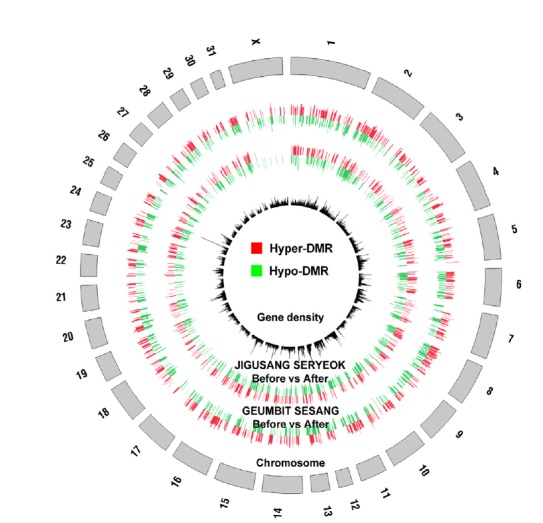
Fig. 3.

Comprehensive maps of the whole-genome methylome in two horse blood before and after exercise. Inner black circle represents gene density corresponding to each chromosome. Outer two circles are apparent two horse distribution of DMRs after exercises.
