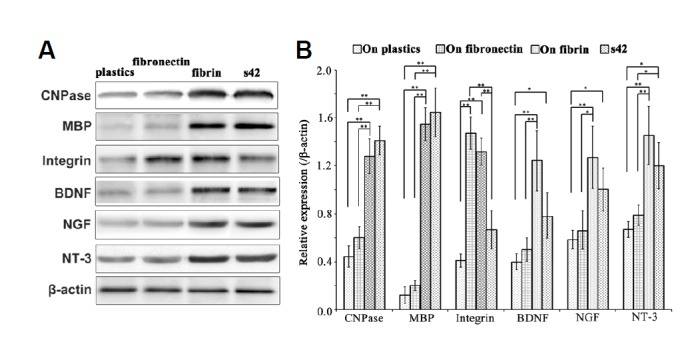
Fig. 7.

Levels of expression of myelination-related molecules and neurotrophins of EMSCs grown on the three substrates and the rat Schwann cell line s42. (A) Representative Western blot in which β-actin served as the loading control. (B) Quantitative analysis of the Western blot; each bar represents the mean value ± SEM of measurements made on five replicates. *P < 0.05, **P < 0.01.
