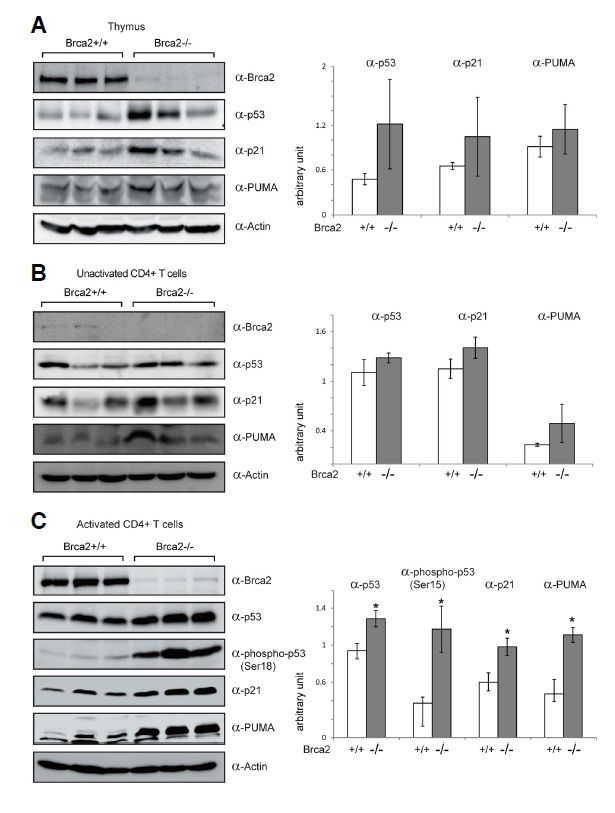
Fig. 5.

The p53 pathway is activated in T cells of [Brca2F11/F11; Lck-Cre] mice. Western blot analysis was performed on the thymic (A) and CD4+ splenic T cells as fresh (B) or 48 h after anti-CD3 and anti-CD28 antibody stimulation (C), from the WT and [Brca2F11/F11; Lck-Cre] mice. Actin was used as a loading control. Signals for p53 phosphorylation (mouse pSer18) were detectable only in activated T cells. Western blot data were quantified by densitometry and normalized by Actin signals (bar graphs on the right). On the bar graphs, Y axis is an arbitrary unit and each bar represents average +/− SD from 3 mice. The p values < 0.05 are marked as asterisks.
