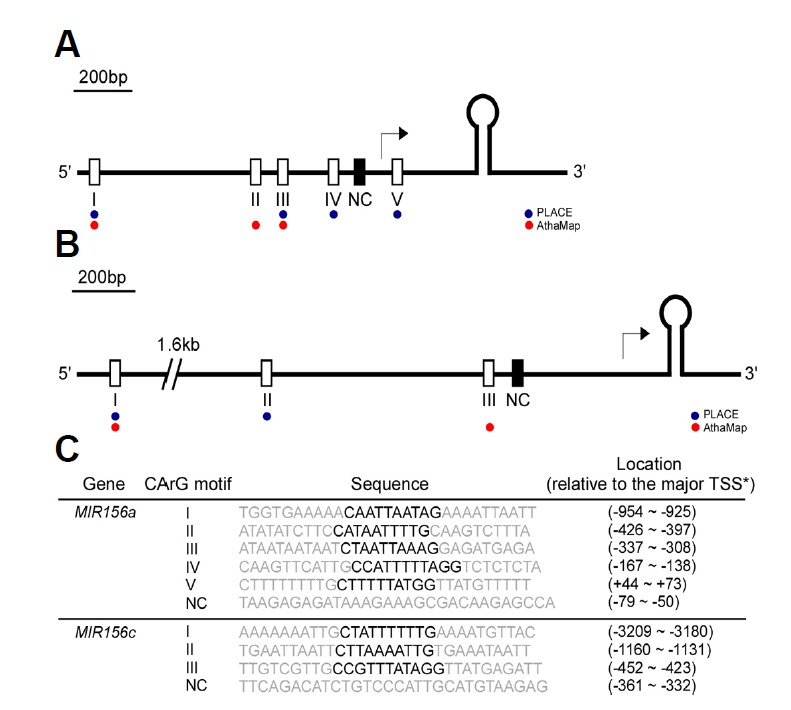
Fig. 3.

Schematic representation of the locations of CArG motifs within the upstream region of the fold-back structure of miR156a (A) and miR156c (B). The putative CArG motifs predicted by PLACE and AthaMap (Hehl and Bülow, 2014; Higo et al., 1998) are indicated by blue and red dots, respectively. Open and closed boxes indicate putative CArG motifs and negative control (NC), respectively. The major transcription start site (TSS) previously reported (Xie et al., 2005) is denoted with an arrow. (C) Sequence information for the CArG motifs used for probes. Core CArG motifs are marked in bold. TSSs of MIR156a and MIR156c were previously reported (Xie et al., 2005).
