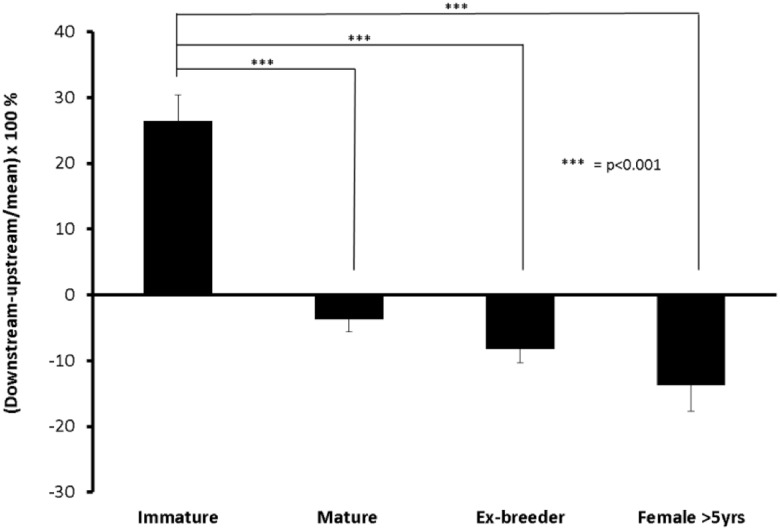
Fig 2. The difference in tracer uptake between regions upstream and downstream of the branch.
Differences are expressed as a percentage of the mean of both regions at the different ages. Positive values indicate higher uptake downstream whilst negative values indicate higher uptake upstream. The trend with age between the three mature groups was significant (p<0.01). Data are shown as mean±SEM.

