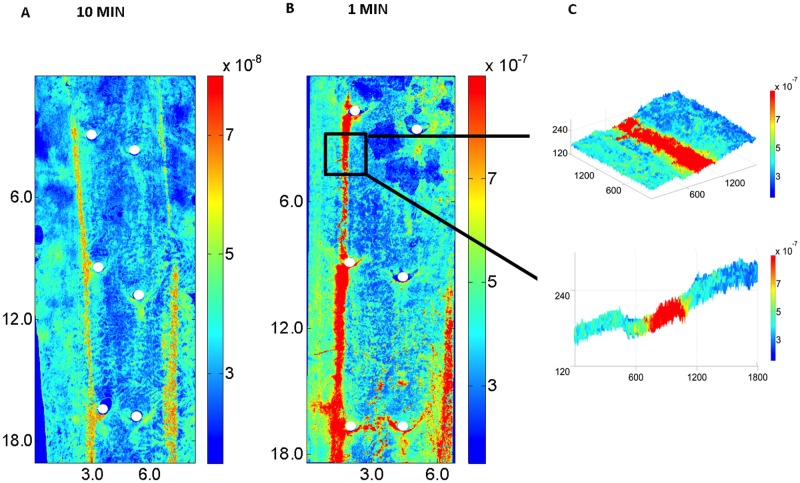
Fig 8. Effect of duration of uptake on streaks.
(a and b) Maps of mass transfer coefficients over a segment of aorta, displayed as in Fig. 6. The aortas were exposed to circulating tracer for (a) 10 or (b) 1 min in vivo and then flushed and fixed via a retrograde cannula inserted after death. (c) A portion of map (b) superimposed on a 3D representation of wall structure, and a 2D slice through the 3D image. Note that depth into the wall is shown on an expanded scale compared to the axial and circumferential dimensions (all in microns).

