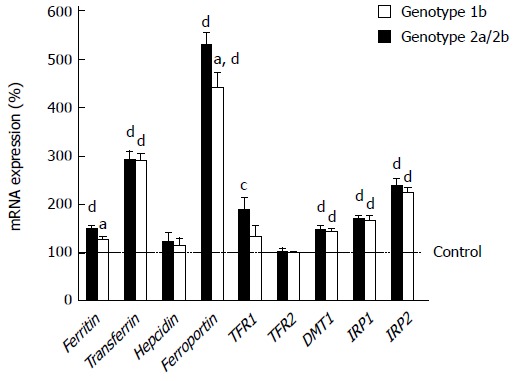
Figure 1.

Expression levels of iron-metabolism-related genes in hepatitis C virus-infected liver in each genotype. The levels were measured by real-time reverse transcription polymerase chain reaction. aP < 0.05 vs genotype1b, bP < 0.01 vs genotype1b, cP < 0.05 vs control, dP < 0.01 vs control.
