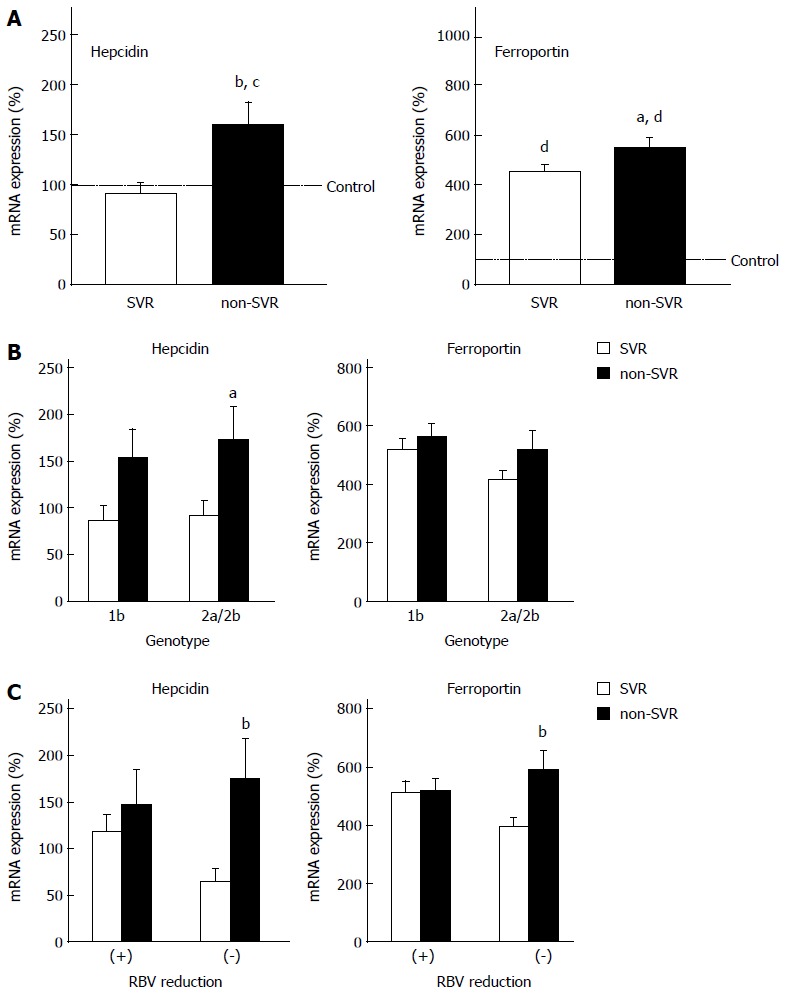
Figure 2.

Expression levels of hepcidin and ferroportin genes. A: Sustained virological response (SVR) vs non-SVR; B: Genotype 1b vs 2a/2b; C: RBV dose reduction (+) vs (−). The levels were measured by real-time reverse transcription polymerase chain reaction. aP< 0.05 vs SVR, bP < 0.01 vs SVR, cP < 0.05 vs control, dP < 0.01 vs control.
