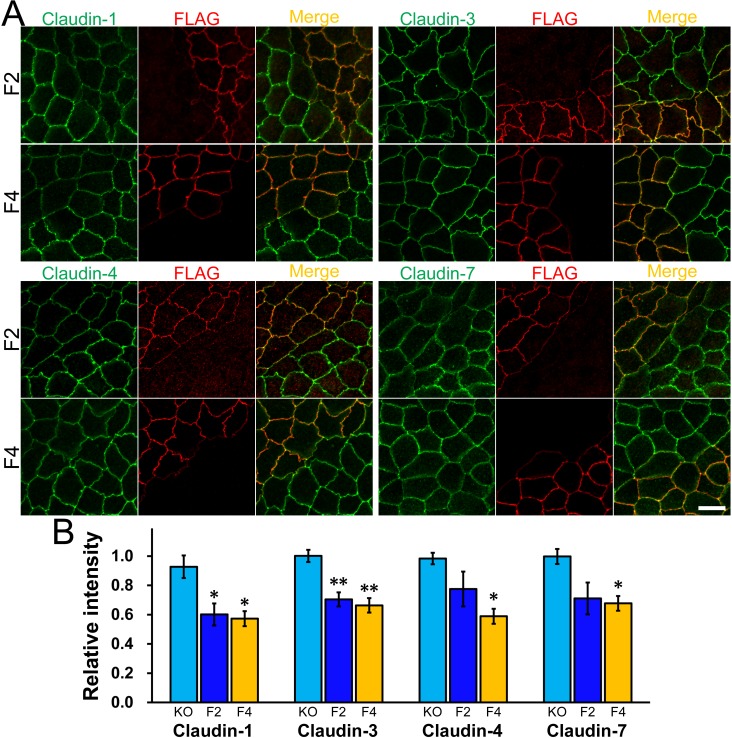
Fig 8. Effects of claudin-2 re-expression on the localization of other claudins in claudin-2 knockout cells.
(A) Immunofluorescence analysis of claudins and FLAG in co-culture of claudin-2 knockout cells and F2 or F4 clones. Claudin-1, -3, -4, and -7 staining at TJs in F2 and F4 clones was weaker than those in claudin-2 knockout cells. Scale bar = 10 μm. (B) Quantification analysis of the signal intensity of claudins at TJs in F2 and F4 clones. The signal intensity of claudin-1, -3, -4, and -7 at TJs in F2 and F4 clones was compared with that in claudin-2 knockout cells. N = 4 for each experiment. * p < 0.05, ** p < 0.01 compared with claudin-2 knockout cells.

