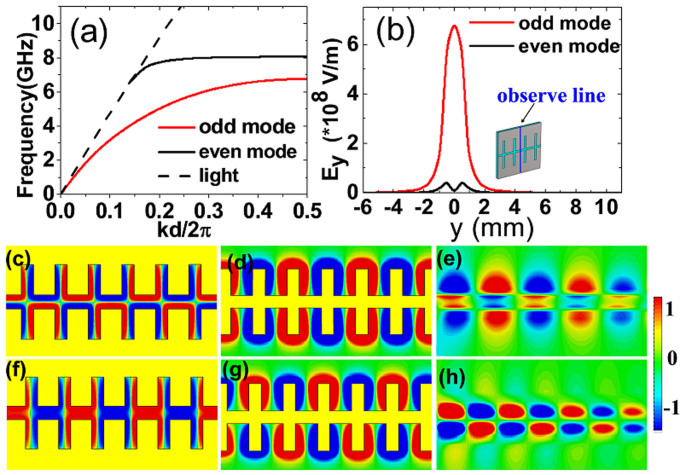
Figure 2.
(a) Dispersion relations of complementary R-shaped grooves for odd mode and even mode. (b) The Ey field distributions for the two modes along the observation line shown in the inset. (c) The spatial variation of the z-component electric field (Ez) for the dominant odd mode of the complementary plasmonic structure at 6.8 GHz. (d) The Ez field distribution for the dominant even mode of the normal corrugated metal strip at 7 GHz. (e) The Ez field distribution for the dominant even mode of the DMD interface in the optical regime at 300 THz. (f–h) The Ez field distributions for the high-order modes of the complementary structure (8 GHz), normal structure (7.8 GHz), and DMD interface (560 THz). The operating frequencies are all close to their asymptotic frequencies, and the yellow parts in Figure (c), (d), (f), and (g) indicate metal.

