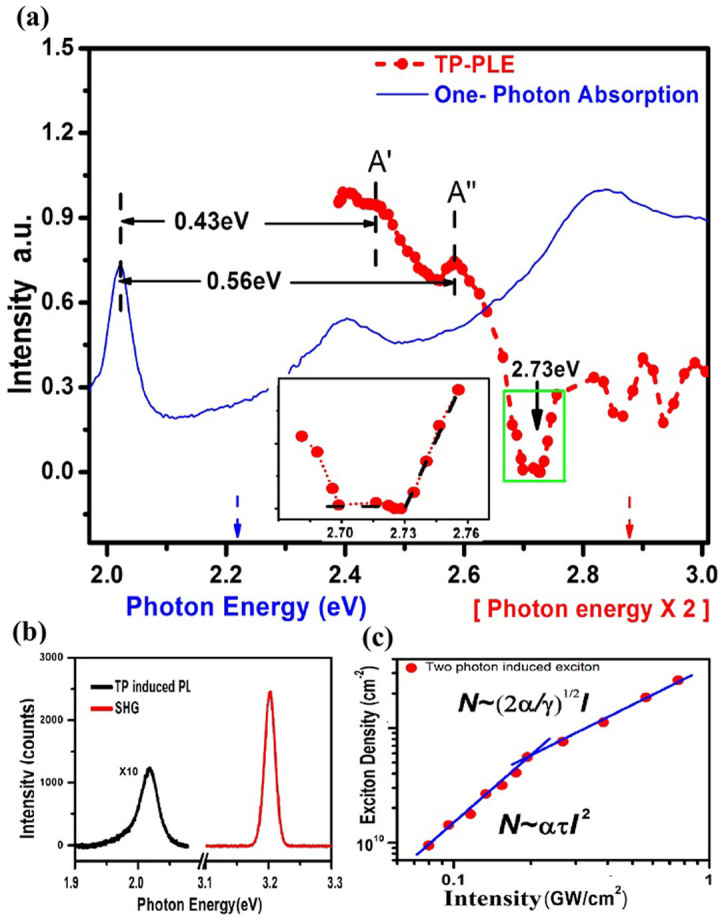
Figure 3. Two-photon photoluminescence excitation spectra at ambient condition.

(a) Comparison of one-photon absorption spectrum (blue) in visible range and two-photon PLE spectrum (red) with the excitation in the range of 1.192 ~ 1.5 eV where the x axis presents the exciton energy (in blue) for linear absorption and the double of the excitation energy (in red) for TP-PLE. Both spectra are obtained at ambient conditions. A′ and A″ denote the excited states of exciton A and the zoom-in of the gap state section is shown in inset. The TP-PL intensity linearly increases with the excitation energy just above the threshold of the interband continuum, presenting the signature of two-photon process in 2D systems where the polarization sits in the 2D plane. (b) The spectra of TP-PL and the second harmonic generation (SHG) at the excitation of 1.6 eV. The integrated intensity of the PL is more than one order of magnitude less than that of the SHG. (c) The intensity of ground state exciton vs. the excitation intensity under the excitation of 1.59 eV. The fitting lines demonstrate a quadratic- (under low intensity) and a linear-dependence (under high intensity) respectively, which yield the exciton-exciton annihilation rate γ ≈ 0.31–0.47 cm2/s and the two-photon absorption cross section α ≈ 3.5–5.3 × 104 cm2W−2S−1.
