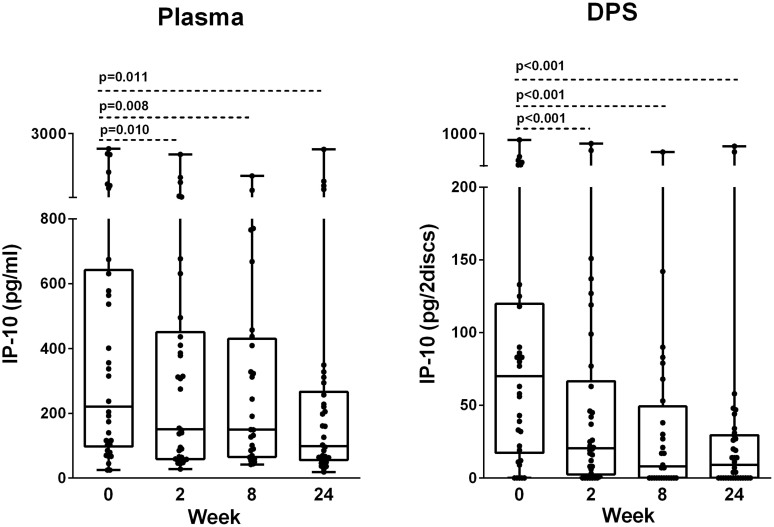
Figure 1. Dynamics of IP-10 in plasma and Dry Plasma Spots (DPS) during anti-TB chemotherapy.
IP-10 levels measured in plasma and DPS in patients with active TB during 24 weeks of effective anti-TB chemotherapy: Baseline (week 0) (N = 34), week 2 (N = 34), week 8 (N = 28), week 24 (N = 34). Box-whisker plots with median, interquartile ranges and min/max values indicated. P-values were calculated by Wilcoxon Signed Ranks test. A significance level of 0.05 was used.

