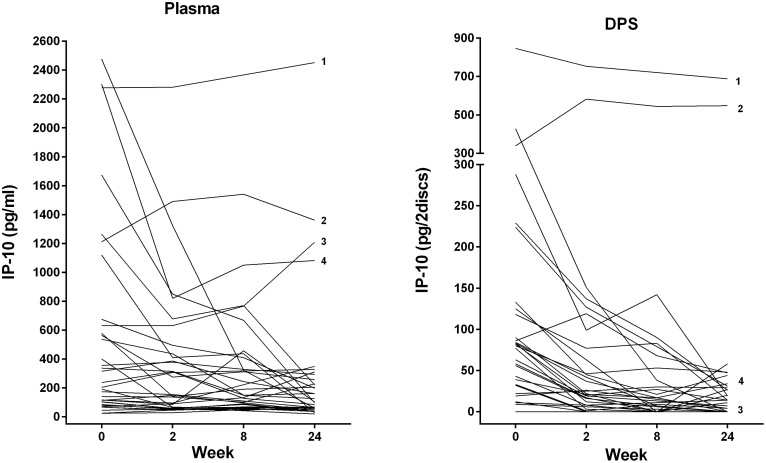
Figure 2. Comparison of Plasma and Dry Plasma Spots (DPS) IP-10 in Individual patients during anti-TB chemotherapy.
IP-10 levels during 24 weeks of effective anti-TB chemotherapy in (A) plasma and (B) DPS in patients with active TB (N = 34): Baseline (week 0) (N = 34), week 2 (N = 34), week 8 (N = 28), week 24 (N = 34). 1Patient with pulmonary TB, previously treated (2 years earlier), but responding to present therapy with negative culture, 2Patient with Crohn's disease diagnosed during TB treatment, 3Patient with paradoxical reaction of glandular TB during treatment, 4Patient with disseminated TB and exacerbation of known Crohn's disease from week 2.

