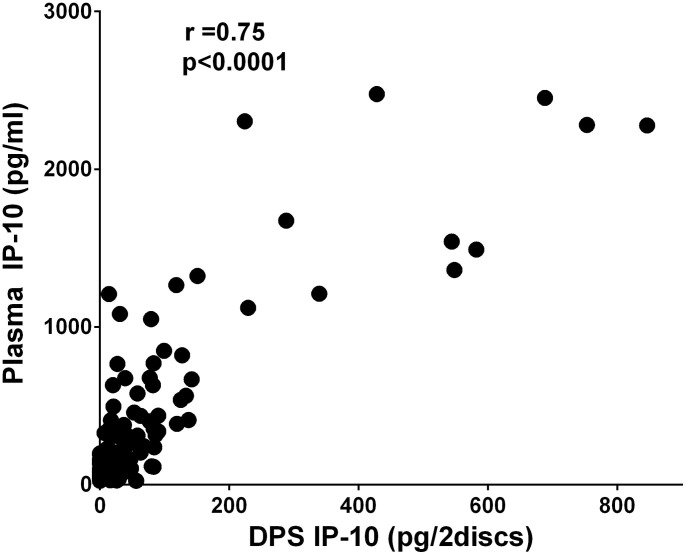
Figure 3. Correlation between IP-10 levels measured in plasma and Dry Plasma Spots (DPS).
Correlation between plasma samples and DPS for all TB patients at all time-points during treatment (baseline, 2, 8 and 24 weeks). Correlation coefficients were calculated by Spearman's rho (significant values at the 0.01 level, 2-tailed).

