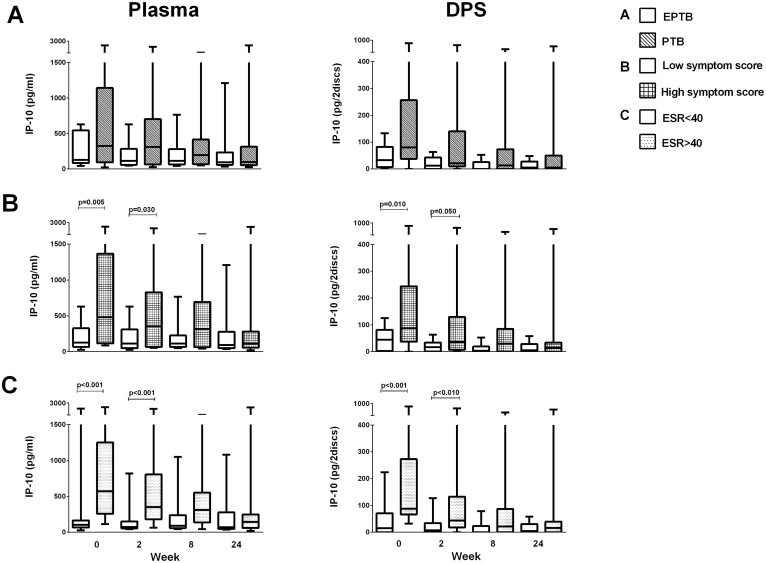
Figure 4. IP-10 levels in clinical TB subgroups during anti-TB chemotherapy.
Plasma IP-10 and Dry Plasma Spots (DPS) IP-10 during 24 weeks of anti-TB chemotherapy in (A) extrapulmonary TB (EPTB, N = 14, white box) and pulmonary TB (PTB, N = 14, hatched box), (B) patients with “low symptom score” (N = 16, white box) and “high symptom score” (N = 18, hatched box) and (C) Erythrocyte Sedimentation Rate (ESR) < 40 (N = 16, white box) and >40 (N = 16, hatched box). Box-whisker plots with median, interquartile range and min/max values indicated. P-values were calculated by Mann-Whitney U test. A significance level of 0.05 was used.

