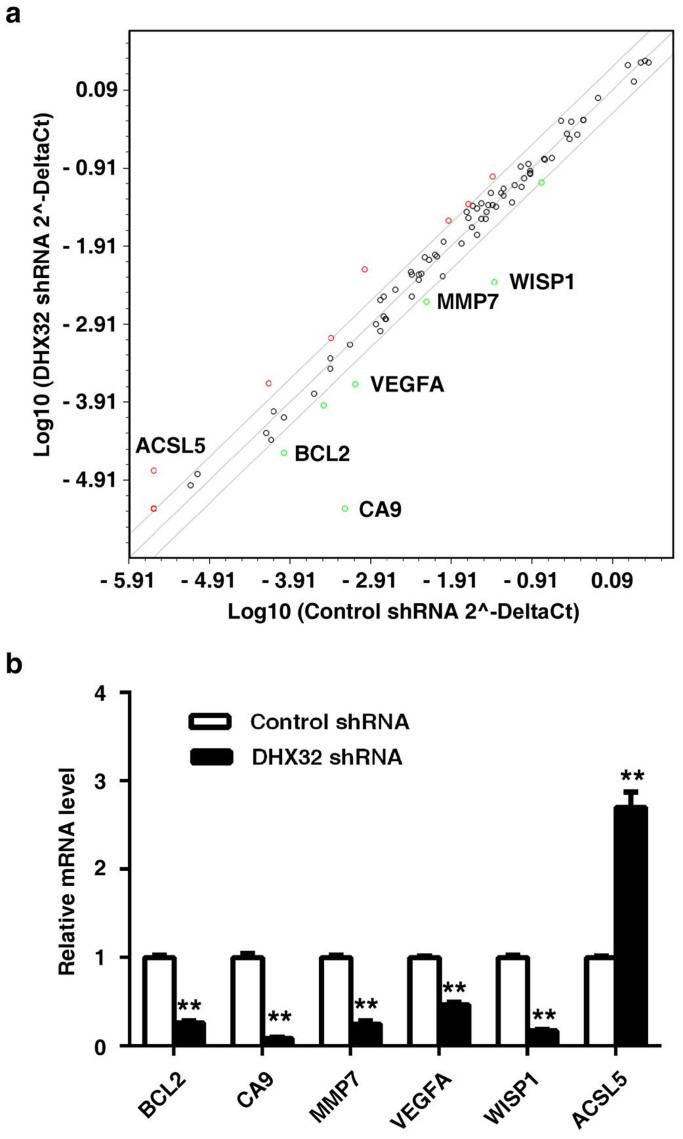
Figure 5. Depleting DHX32 induces gene expression changes in SW480 cells.
(a), Real-time RT-PCR analyses of gene expression with the Signal Transduction Pathway Array from SA Biosciences. The genes with twofold changes are plotted. Upregulated genes are shown in red, and downregulated genes in green. (b), Real-time RT-PCR analyses for the genes identified in the miniarray. β-actin was used as an internal loading control. **P<0.01.

