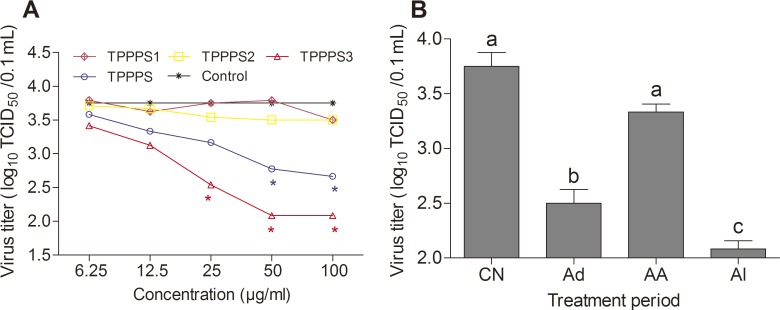
Fig 6. Effects of TPPPS1-3 and TPPPS on antiviral activity in vitro.
(A) DF1 cells cultured in 24-well plates were infected with 10 μL/well (TCID50 of 103.75/0.1 mL) ALV-B. After 9 d of culture in MM containing different concentrations of TPPPS or TPPPS1-3, viral titers in the supernatant were directly determined by TCID50 assays on DF1 cells. PBS treatment wells served as the control. All values shown are presented as means ± SD from three independent experiments. An asterisk indicates that the value of the corresponding group was significantly different from that of the control group (P < 0.05, ANOVA). (B) DF1 cells infected with ALV-B were treated with 50 μg/mL of TPPPS3 at different viral infection periods, and viral titers in the supernatant were directly determined by TCID50 assays on DF1 cells. Ad is defined as the “adsorption” period; AA is defined as the period “after adsorption”; Al is the period wherein the polysaccharide was always present. PBS treatment wells served as the control. All values shown are presented as means ± SD from three independent experiments. Different superscripts indicate a significant difference (P < 0.05).

