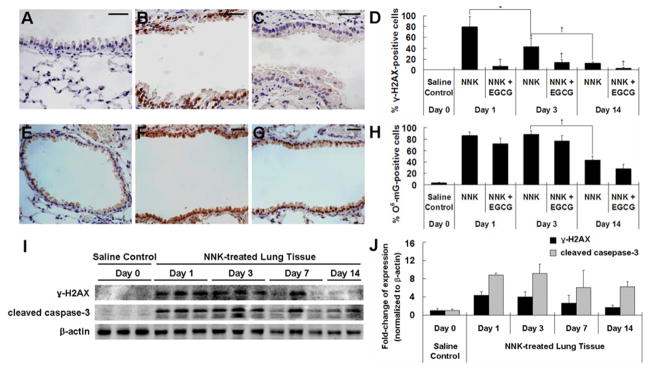
Fig. 2.

NNK-induced elevation of γ-H2AX and O6-mG in lung tissues of NNK-treated mice and inhibitory effect of EGCG. (A–C) Representative IHC microphotographs for γ-H2AX staining in lung tissues from day 0 saline control group (A), day 1 NNK-treated group (B) and day 1 NNK + 0.5% EGCG group (C). (D) Quantification of γ-H2AX-positive cells in bronchial epithelial cells of NNK-treated and NNK + EGCG-treated mice at days 1, 3 and 14. (E–G) Representative IHC microphotographs for O6-mG staining in lung tissues from day 0 saline control group (E), day 1 NNK-treated group (F), and day 1 NNK + 0.5% EGCG group (G). (H) Quantification of O6-mG-positive cells in bronchial epithelial cells of NNK-treated and NNK + EGCG-treated mice at days 1, 3 and 14. (I) Representative Western Blot of protein levels of γ-H2AX and cleaved caspase-3 in lung tissues of saline- or NNK-treated mice at days 1, 3, 7 and 14 after NNK treatment. (J) Quantification of Western blot results. Values shown in the bar graphs are means ± SD (n = 25 (5 slides × 5 fields) for IHC and n = 3 for Western blot); * (P < 0.05) and † (P < 0.01) indicate statistical significance by student’s t-test for NNK + 0.5% EGCG treatment group as compared with same day NNK treatment group or NNK treatment groups at days 1, 3 and 14. Scale bar represents 50μm.
