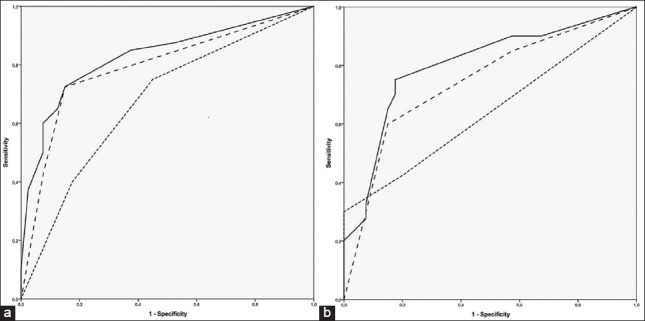
Figure 1.

The receiver operating curve (ROC) plots constructed for parameters of global Moorfields regression analysis (MRA), global optical coherence tomography (OCT) and combination of MRA and OCT. The dotted line represents diagnostic ability of MRA alone, dashed line represents diagnostic ability of OCT alone and solid line represents diagnostic ability of MRA and OCT combination. (a) ROC plot of subjects with average disc area, (b) ROC plot of subjects with large disc area
