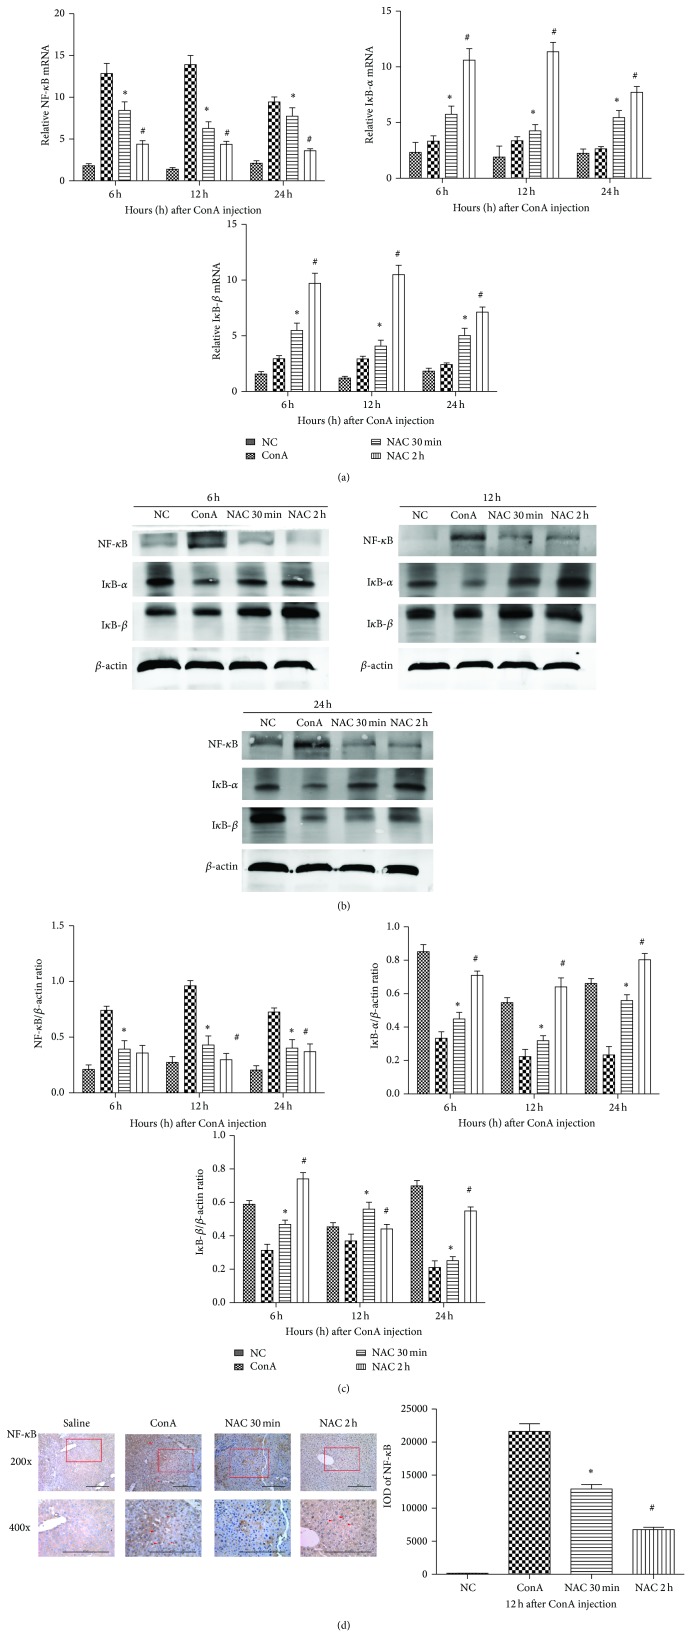
Figure 4.
The effect of NAC on NF-κB pathway in ConA-induced hepatitis in mice. (a) The expressions of NF-κB, IκB-α, and IκB-β on mRNA levels were detected by real-time PCR. Data are expressed as mean ± SD (n = 6; * P < 0.05 for ConA versus NAC 30 min; # P < 0.05 for NAC 30 min versus NAC 2 h). (b) The expressions of NF-κB, IκB-α and IκB-β on protein levels were detected with western blot. (c) The results of western blot were analyzed with Quantity One. Data are expressed as mean ± SD (n = 6; * P < 0.05 for ConA versus NAC 30 min; # P < 0.05 for NAC 30 min versus NAC 2 h). (d) The expressions of NF-κB on protein levels were detected by immunohistochemistry staining in hepatic tissues at 12 h (×200 and ×400 magnification). The positive cells were indicated with red arrows. The result was analyzed using Image-Pro Plus 6.0. Date are showed as mean ± SD (n = 6; * P < 0.05 for ConA versus NAC 30 min; # P < 0.05 for NAC 30 min versus NAC 2 h).

