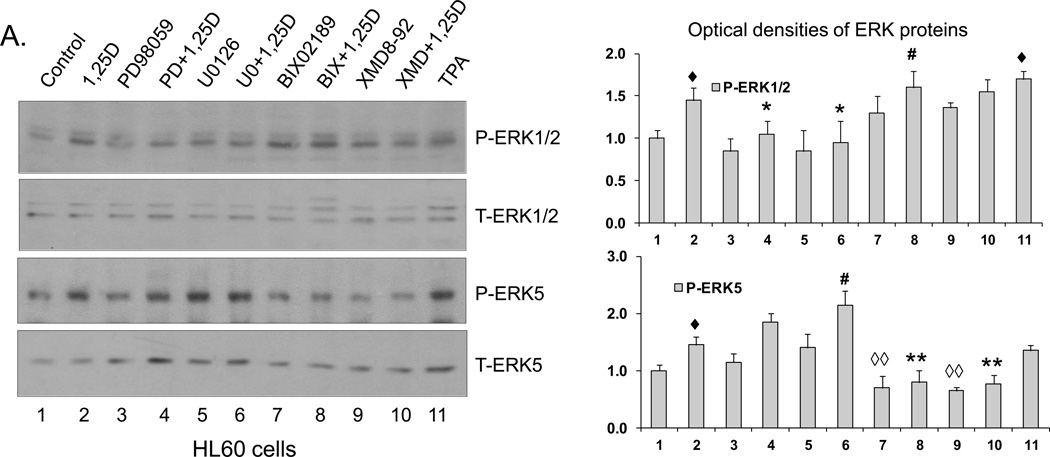
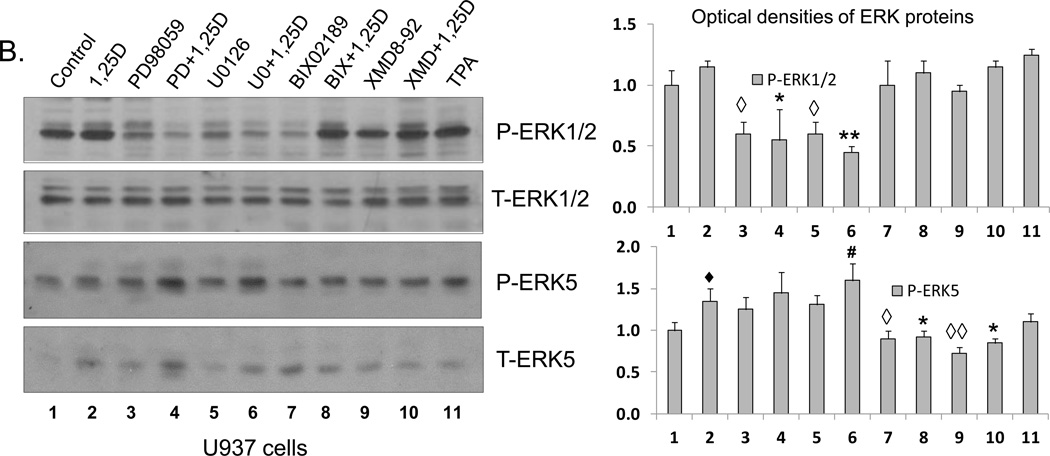
Fig. 1. Western blots showing the specificity of ERK1/2 and ERK5 inhibitors.
(A) HL60 cells were pretreated with either MEK1/2 inhibitors, PD98059 (20 µM) and U0126 (1 µM), or MEK5/ERK5 inhibitors, BIX02189 (10 µM) and XMD8-92 (5 µM), for 1 h, then 1,25D (1 nM) was added for an additional 96 h. TPA (10 nM) treated group was used as positive control. P-ERK1/2 and P-ERK5 protein levels were determined by Western blots. Normalized optical densities of each band are shown in the bar charts. The blots shown are representative of three experiments. CTL = Control. (B) U937 cells were treated in the same manner as HL60 cells. ◆ = p<0.05, significantly increased vs. control group; ◇ = p<0.05, ◇◇ = p<0.01, significantly decreased vs. control group; # = p<0.05, significantly increased vs. 1,25D-treated group; * = p<0.05, ** = p<0.01, significantly decreased vs. 1,25D-treated group; n=3.


