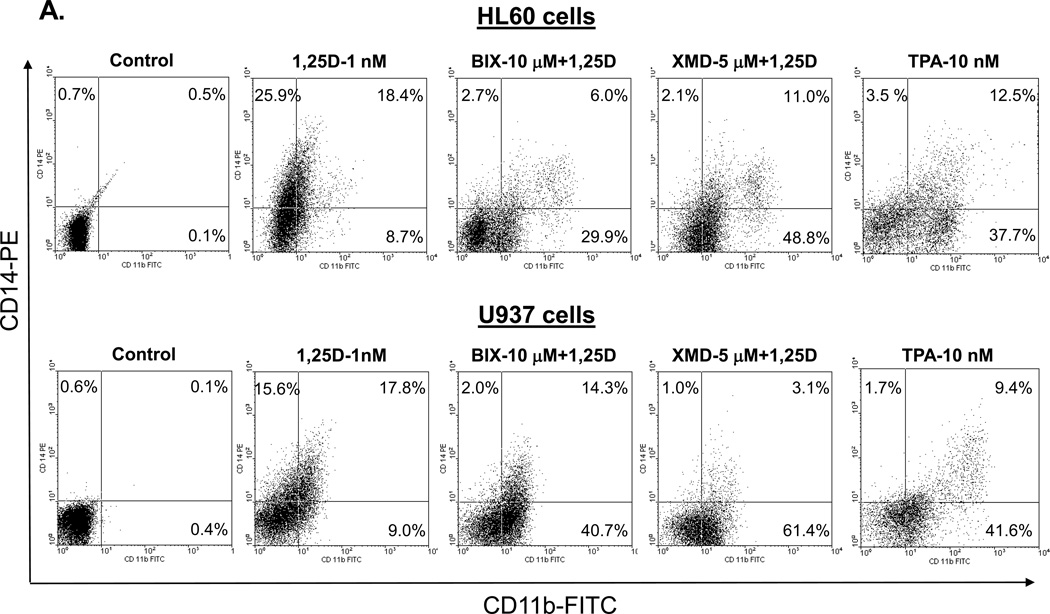
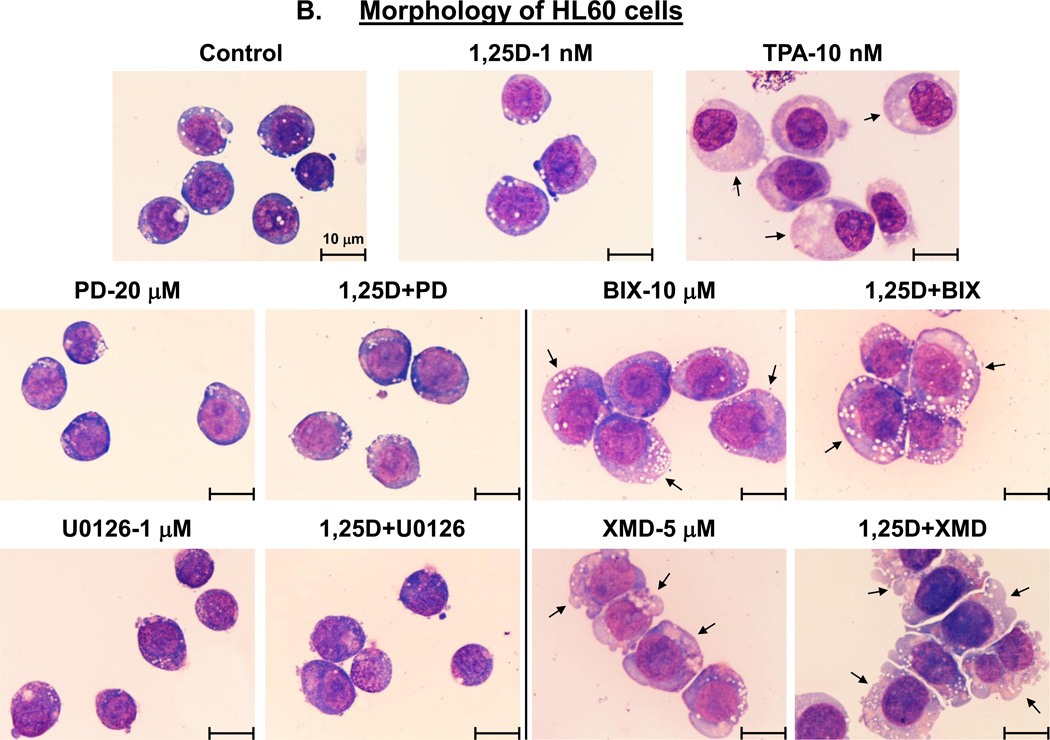
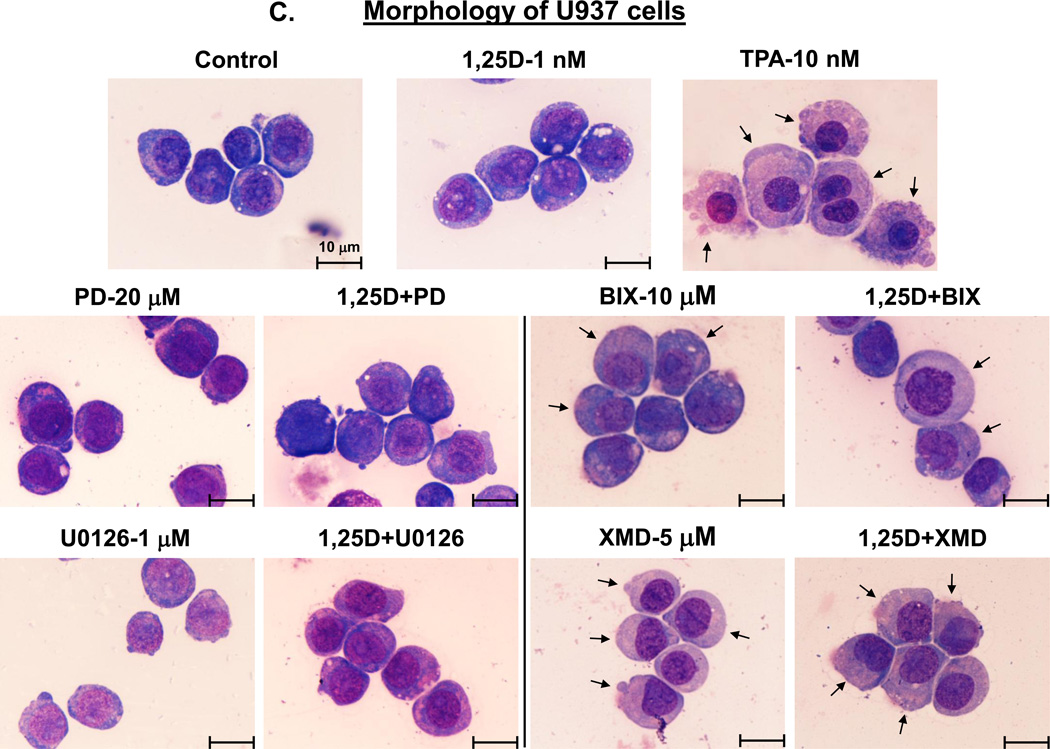
Fig. 2. Inhibition of the MEK1/2-ERK1/2 and MEK5/ERK5 pathways differentially affects the cell surface marker expression and morphology of AML cells.
(A) An example of primary flow cytometry data. These frames show the similarity of changes in cell surface expression of differentiation markers induced by treatment with TPA or MEK5/ERK5 inhibitors together with 1,25D. Note that TPA, like the inhibitors and 1,25D combinations, increases the expression of CD11b (horizontal scale), but reduces the expression of CD14 (vertical scale). HL60 and U937 cells were pretreated with either MEK5/ERK5 inhibitors, BIX02189 (10 µM) and XMD8-92 (5 µM), or TPA 10 (nM) for 1 h, then 1,25D (1 nM) was added for an additional 96 h. N=3. (B) HL60 cells were pretreated with either MEK5/ERK5 inhibitors, BIX02189 (10 µM) and XMD8-92 (5 µM), or MEK1/2 inhibitors, PD98059 (20 µM) and U0126 (1 µM) for 1 h, then 1,25D (1 nM) was added for an additional 96 h. (C) U937 cells were subjected to identical treatments. Following incubations, cell smears were stained with Wright-Giemsa and photographed at 1000× magnification. TPA (10 nM) was used as the positive control for the induction of macrophage differentiation. Arrows indicate the more abundant cytoplasm in cells treated with MEK5/ERK5 inhibitors, alone and in combination with 1,25D, and TPA, typical of macrophages. Other typical features evident in this group are nuclear morphology, ameboid pseudopodia, and abundant cytoplasmic inclusions, better seen in HL60 cells. Scale lines within the panels indicate 10 µm.


