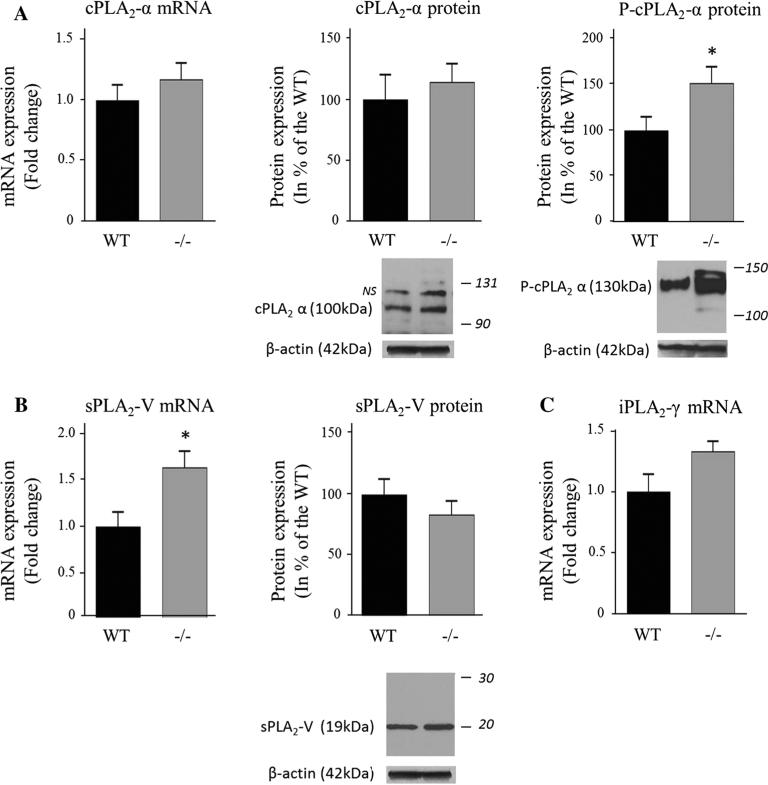
Fig. 2.
Expression of cPLA2α (a), sPLA2-V (b) and iPLA2c in WT and iPLA2β−/− mice. mRNA was quantified in duplicate with Taqman® RT-PCR using the ΔΔCt method and normalization to 18S expression. Results are expressed as mean ± SEM (n = 8). cPLA2α and sPLA2-V protein was measured in brain cytosol and P-cPLA2α was quantified in the membrane fraction by Western blot. Results are normalized to β-actin expression (representative immunoblot is displayed) and expressed as % of the WT mice as mean ± SEM (n = 8, except n = 7 for P-cPLA2 in iPLA2β−/− because an outlier value of 7.4 was removed). Numbers in italics indicate molecular weight markers (in kDa), NS : non-specific band. *P < 0.05 (t-test)

