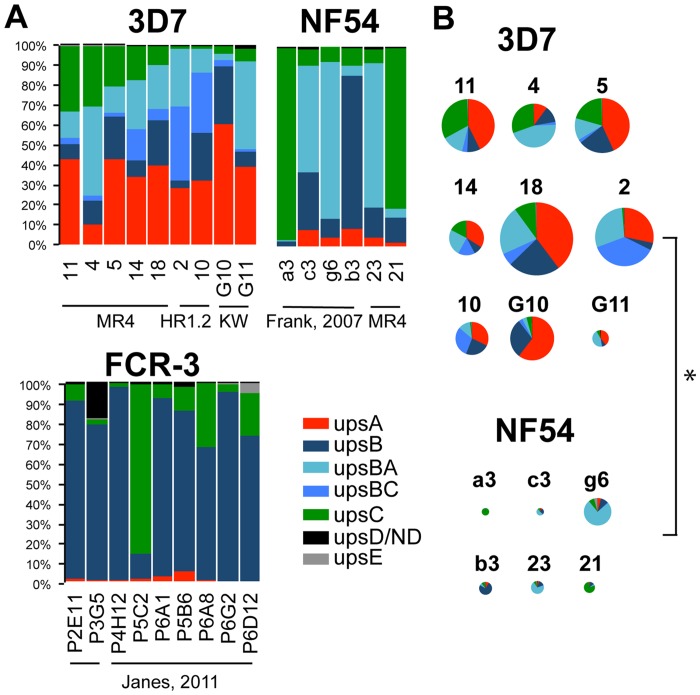
Fig 1. Polarized expression of var genes subsets in different strains.
A: Analysis of var subset expression within clones of 3D7, NF54 and FCR-3 from disparate sources, demonstrating skews in var sub-class expression. 3D7 clones were derived from three different sources (MR4 3D7, 3D7 HR1.2 and 3D7 KW). NF54 clones were derived from the MR4 strain and var gene expression was compared to that previously obtained from clones of a distinct source of NF54 [31]. Var expression data for FCR-3 was obtained from clones previously examined from two parental parasite sources [11]. Var expression patterns are group representations that were determined by qRT-PCR using gene-specific primers for the entire var family in 3D7/NF54, normalized to seryl-tRNA-synthetase and sorted by ups-group. Var expression patterns were measured by qRT-PCR using gene-specific primers for the majority of the family in FCR-3, sorted by ups-group and normalized to the average abundance of the transcript of adenylosuccinate lyase. Independent clones are shown for each strain (different sources are denoted by underline). B: Relative copy numbers (RCN) for all of the genes within each 3D7 and NF54 strain were summed, and the proportions of expression of each subset within each genetic background are indicated. RCN was calculated by comparison to the abundance of transcripts encoding seryl-tRNA-synthetase (results were also similar if compared to the ring-stage-specific genes encoding SBP1 (PF3D7_0501300) and MAHRP (PF3D7_1370300)). Pie charts show proportions of each var transcript and the size of the chart is proportional to the total RCN. * denotes significant difference of p < 0.01.

