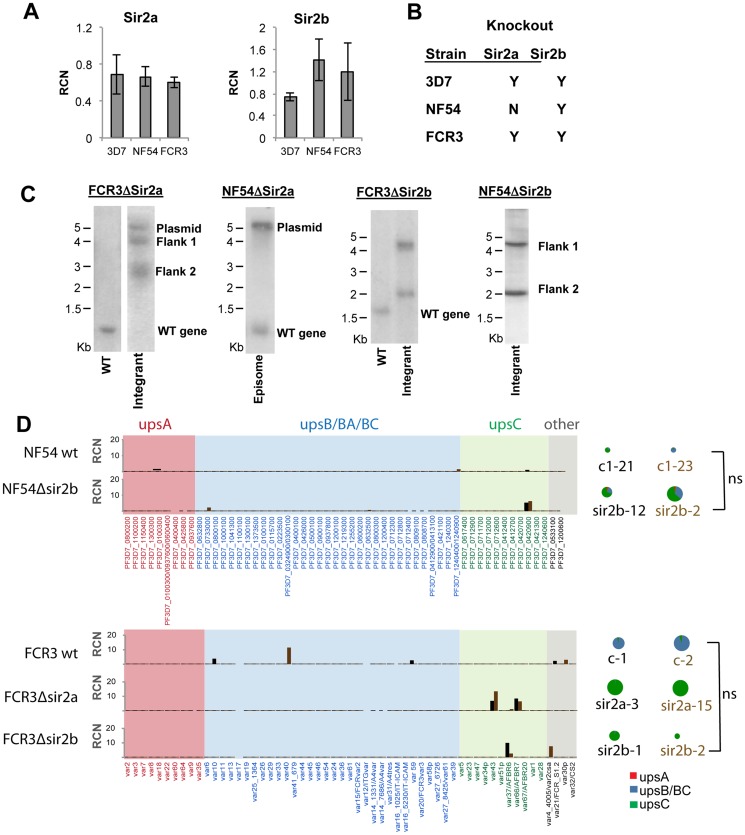
Fig 2. Sirtuin expression and genetic targeting in NF54 and FCR-3.
A: Quantitative RT-PCR analysis of PfSir2a and PfSir2b expression in schizont-stage 3D7, NF54 and FCR-3. RCN is calculated by comparison to the average abundance of transcripts encoding two control genes: seryl-tRNA-synthetase and myosin. Plot shows average of 2 biological replicates, measured in technical duplicate. B: Table showing sirtuin gene disruptions attempted and achieved in 3D7, NF54 and FCR-3. C: Southern blots showing disruption of PfSir2b in NF54, PfSir2a and PfSir2b in FCR-3, and attempted but unsuccessful disruption of PfSir2a in NF54. The expected sizes for the FCR-3Δsir2a and NF54Δsir2a endogenous genomic locus, integrated flank 1, integrated flank 2 and concatamerized plasmid following AccI/NdeI digestion are 1.1 kb, 3.9 kb, 2.4 kb and 5.2 kb, respectively. The expected sizes for the FCR-3Δsir2b and NF54Δsir2b endogenous genomic locus, integrated flank 1, integrated flank 2 and concatamerized plasmid following ScaI/HpaII digestion are 1.7 kb, 4.2 kb, 2.1 kb and 4.5 kb. D: Var expression patterns in two clones each of NF54 wt, NF54Δsir2b, FCR-3 wt, FCR-3Δsir2a and FCR-3Δsir2b measured by qRT-PCR using gene-specific primers for the majority of the var gene family, sorted by ups-group. RCN was calculated by comparison to the abundance of transcripts encoding the average of the three control genes seryl-tRNA synthetase, arginyl-tRNA synthetase and glutaminyl-tRNA synthetase. Individual clones denoted in black and brown bars. Pie charts define percentage of each ups class expressed, and are sized proportional to the total RCN. ns = no significant difference between total var gene expression levels in the individual strains.

