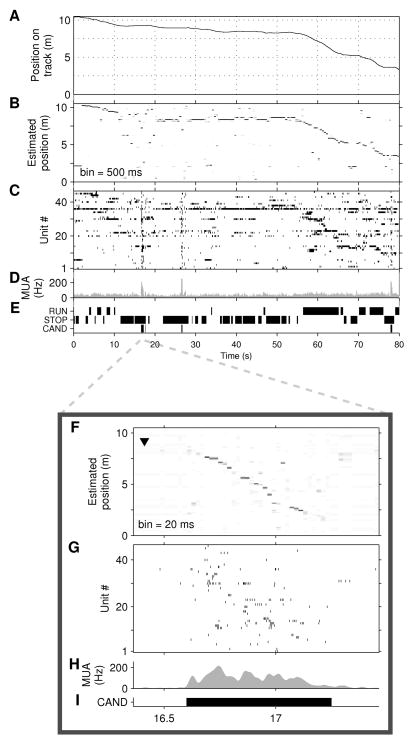
Figure 2. Replay detection using position reconstruction.
A–E, Behavior and position reconstruction for a 80-second epoch during which rat 1 runs approximately 7 m (from 10.3m to 3.5m), while pausing frequently. A, True position of animal. B, Estimated position. Each column is a probability density function estimated from unit activity in a 500 ms window. (White: p=0; black: p=1). C, Raster plots of spike times. Units are ranked by their preferred firing location; unit 1 has a place field closest to 0 m. Note bursts at 17 s, 27 s, and 78 s, which recruit a large fraction of all units. D, Multi-unit activity (MUA; average spike rate per tetrode, including unclustered spikes). E, Identified periods of RUN and STOP and candidate replay events (CAND). F–I, Position reconstruction applied to a candidate event revealing extended replay. F, Estimated position (20 ms bins) describes a trajectory from 8 m to 2 m while the animal remains stationary at 9 m (black arrowhead). The direction of the arrowhead indicates that the animal is facing in the B→A direction. G, Raster plot of unit firing. H, MUA. I, Candidate event. This event is the third example shown in Supplementary Movie 2.

