
Figure 3. Extended replay.
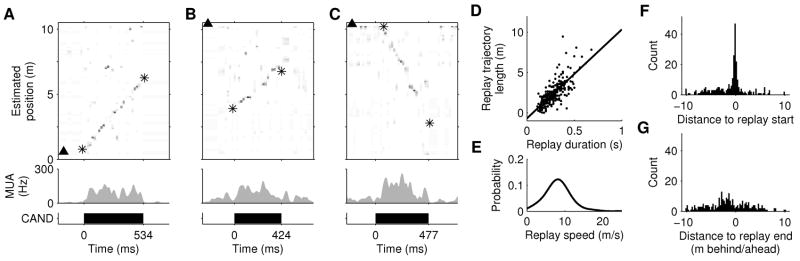
A–C, Examples of extended replay from rats 1–3. Top: Estimated position (asterisks indicate start/end of detected linear trajectory). Middle: MUA. Bottom: extent of replay event. D, Length of replayed trajectory vs. event duration for all replays. Solid line: linear regression (slope = 11.1 m/s; R2 = 0.59; p<10−10). E, Kernel density estimate (Gaussian kernel, width = 1.5 m/s) of the distribution of replay speeds. F–G, Distribution of start (F) and end (G) locations of replay trajectories relative to the animal’s position and heading on the track. A negative distance indicates the replayed trajectory starts or ends behind the animal (along the track).