
Figure 2.
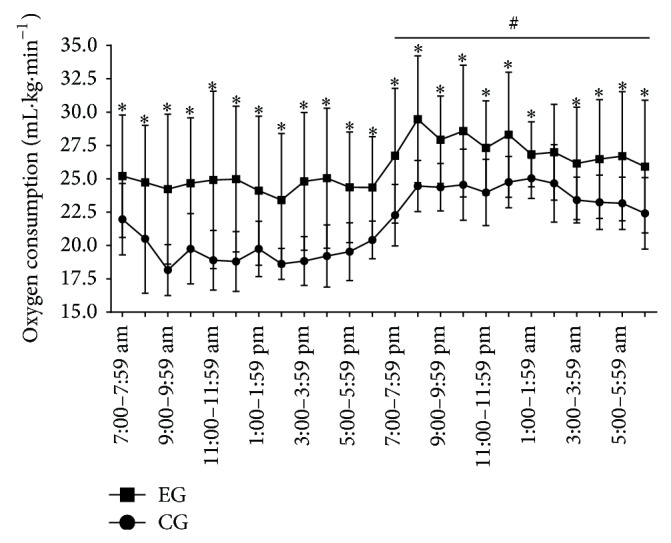
Oxygen consumption for 24 hours after the end of SD. (-■-) Experimental group (EG) and (-●-) control group (CG). The horizontal black line shows the dark period (7:00 pm–6:59 am). Data are shown as the mean ± standard deviation; statistical significance was accepted at P < 0.05; (*) difference between the CG at EG at each time point, (#) mean different between light and dark periods within each group.