
Figure 1.
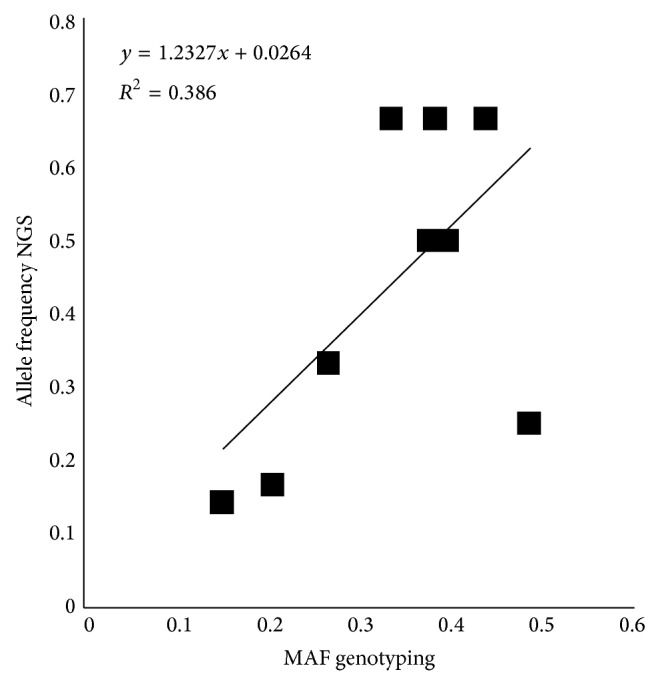
Scatter plot of allele frequency estimated by Ion Torrent sequencing data for SNPs called by at least 6 reads (allele frequency NGS) and obtained by genotyping data (MAF genotyping) for the same SNPs.
Official websites use .gov
A
.gov website belongs to an official
government organization in the United States.
Secure .gov websites use HTTPS
A lock (
) or https:// means you've safely
connected to the .gov website. Share sensitive
information only on official, secure websites.
Scatter plot of allele frequency estimated by Ion Torrent sequencing data for SNPs called by at least 6 reads (allele frequency NGS) and obtained by genotyping data (MAF genotyping) for the same SNPs.