
Figure 1:
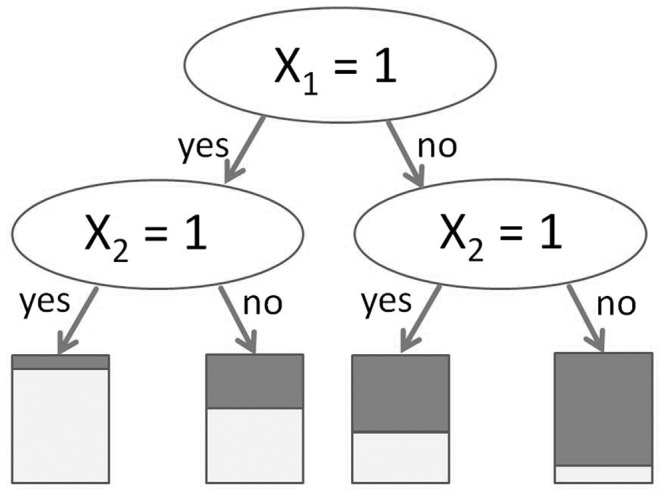
Idealized tree in the presence of two predictor variables, X1 and X2 with main effects only (no interaction). The bars at the bottom of the tree denote the proportion of observations with Y = 0 and Y = 1 in the respective leaves.
Official websites use .gov
A
.gov website belongs to an official
government organization in the United States.
Secure .gov websites use HTTPS
A lock (
) or https:// means you've safely
connected to the .gov website. Share sensitive
information only on official, secure websites.
Idealized tree in the presence of two predictor variables, X1 and X2 with main effects only (no interaction). The bars at the bottom of the tree denote the proportion of observations with Y = 0 and Y = 1 in the respective leaves.