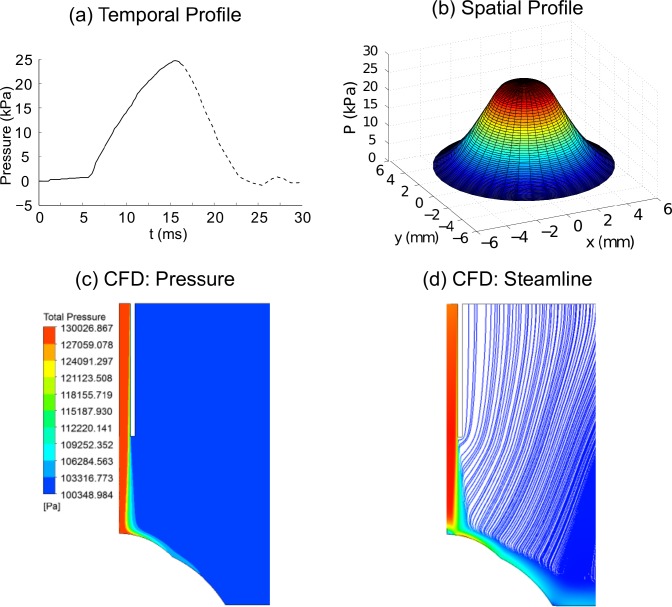
Fig 3. Non-contact tonometer air-puff loading and CFD results.
a) Temporal pressure profile applied on the center of the cornea (corneal apex region). Solid black line represents the temporal profile used in the simulations. Dashed black line was no considered since only the maximum displacement of the corneal apex was studied; b) Spatial profile of pressure applied on cornea obtained with the CFD simulation shown in c) and d); c) Symmetrical pressure profile obtained from the CFD simulation; d) Symmetrical velocity streamline plot result from the CFD simulation.

