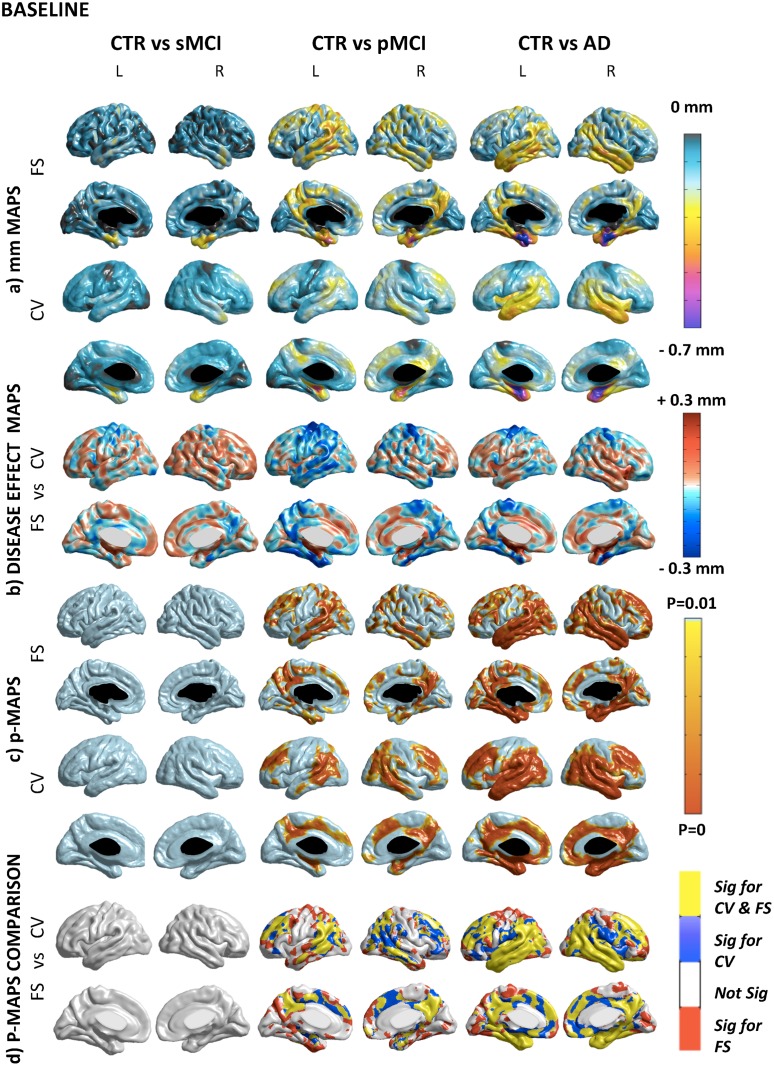
Fig 2. Cross-sectional comparison.
A) Absolute difference maps (mm) in Freesurfer and Civet. The degree of atrophy ranges between 0.1 and 0.7 mm in the different areas of the cortical mantle. B) Disease effect maps. There is a consistent delta (±0.3 mm) among the compared groups. Negative value means higher disease effect for Freesurfer (i.e.: parietal-temporal and precuneus areas); positive value means higher disease effect for Civet (i.e.: association areas and limbic parts of the cortex). C) Statistical difference maps (p<0.01 FDR-corrected). No significant voxels were found comparing CTR to sMCI. Atrophic areas were found contrasting pMCI with CTR (i.e.: the posterior cingulate, temporal lobe and frontal gyrus) with both tools. Comparing CTR versus AD the statistical significance extended (i.e.: medial temporal, retrosplenial, and lateral temporal regions). D) Overlapping and not-overlapping atrophic regions are shown. Significant voxels detected by both pipelines are in yellow; voxels detected only by Civet are in blue; voxels detected only by Freesurfer are in red. CV: Civet; FS: Freesurfer; L: Left hemisphere; R: Right hemisphere; CTR: Normal elderly controls; sMCI: stable MCI; pMCI: progressive MCI; AD: Alzheimer’s Disease.

