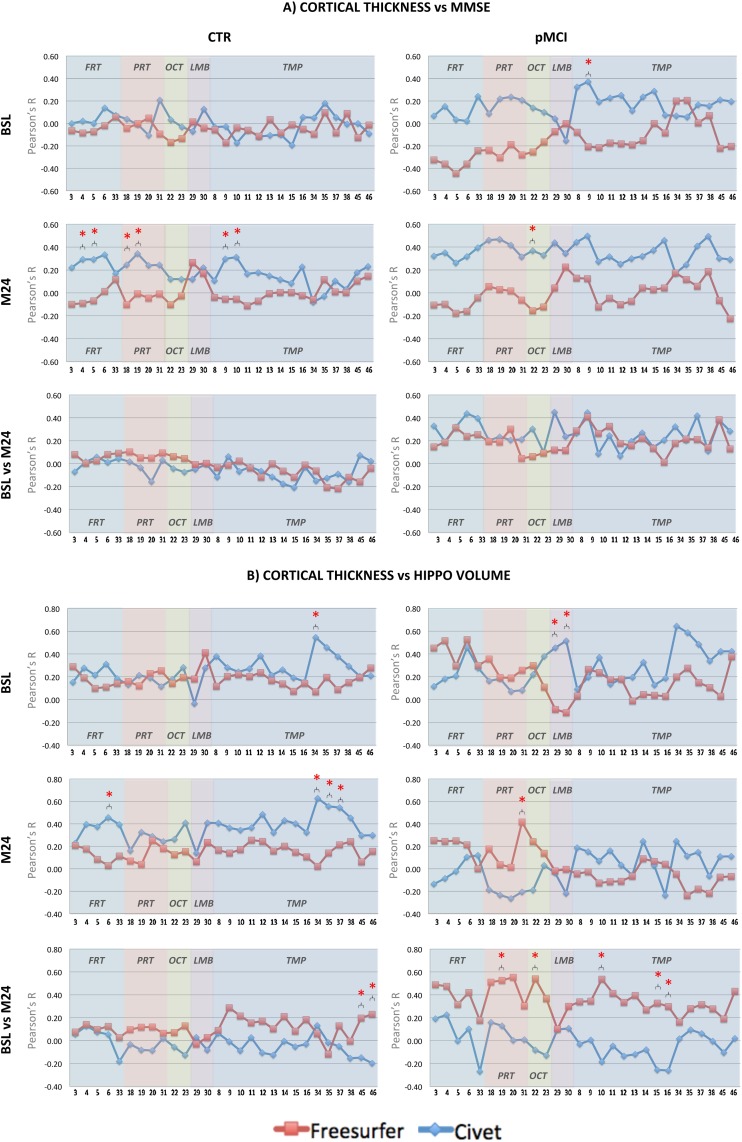
Fig 5. Pearson’s r coefficient of cortical thickness versus MMSE scores (panel A).
In the CTR group, no significant differences between ROIs were detected in the two pipelines at BSL. At M24, significant differences between the two pipelines were found in the: middle frontal gyrus; inferior frontal gyrus—pars triangularis; superior parietal lobule; anterior division of the supramarginal gyrus; anterior and posterior division of the superior temporal gyrus. Longitudinally, no significant differences between ROIs were detected in the two pipelines. In the pMCI group, significant difference between the two pipelines was found at BSL in the: anterior division of the superior temporal gyrus. At M24, significant difference between the two pipelines was found in the: superior division of the lateral occipital cortex. Longitudinally, no significant differences between ROIs were detected in the two pipelines. Pearson’s r coefficient of cortical thickness versus NeuroQuant hippocampal volume (panel B): In the CTR group, significant difference between the two pipelines at BSL was found in the: anterior division of the parahippocampal gyrus. At M24, significant differences between the two pipelines were found in the: inferior frontal gyrus—pars opercularis; anterior and posterior division of the parahippocampal gyrus; anterior division of the temporal fusiform cortex. Longitudinally, significant differences between the two pipelines were found in the: Heschl’s gyrus and temporal planum. In the pMCI group, significant difference between the two pipelines was found at BSL in the: precuneus cortex. Longitudinally, significant differences between the two pipelines were found in the: anterior division of the supramarginal gyrus, superior division of the lateral occipital cortex, posterior division of the superior temporal gyrus, posterior division of the inferior temporal gyrus, temporo-occipital part of the inferior temporal gyrus. In panels A and B, * symbol stands for p<0.05 (Steiger’s z-test). Red coloured lines represent the trends in Freesurfer, blue lines in Civet. CTR.: CTR: Normal elderly controls; sMCI: stable MCI; pMCI: progressive MCI; AD: Alzheimer’s disease; BSL: baseline; M24: month 24; FRT: Frontal; PRT: Parietal; OCT: Occipital; LIMB: Limbic; TMP: Temporal.

