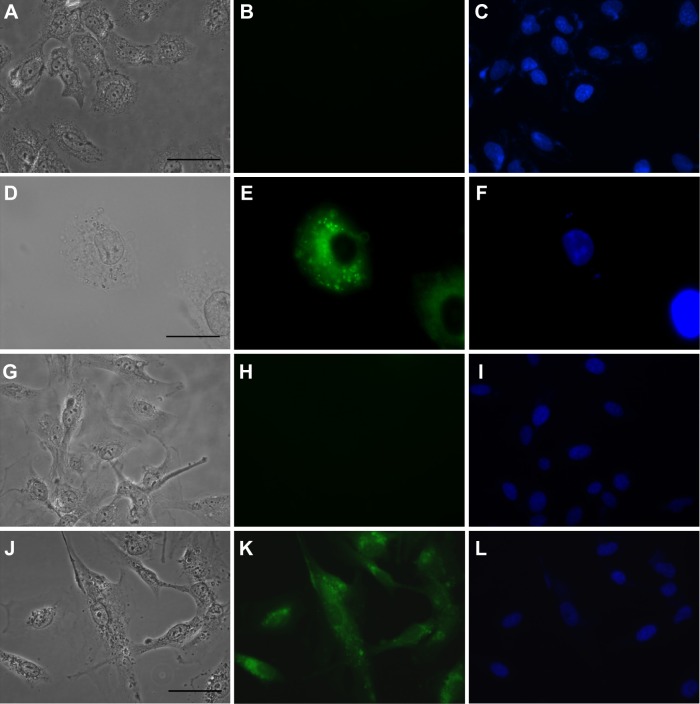
Figure 2.
In vitro uptake of 5 μM gH625.
Notes: The left column shows images acquired with differential interference contrast, the central column with the fluorescein isothiocyanate channel, and the right column with the 4′-6-diamidino-2-phenylindole channel. Each row represents the same field. (A–C) Negative controls for SH-SY5Y cells. (D–F) SH-SY5Y cells treated with gH625. (G–I) Negative controls for U-87 MG cells. (J–L) U-87 MG cells treated with gH625. Scale bars correspond to 50 μm, except for (D–F) where they correspond to 20 μm.

