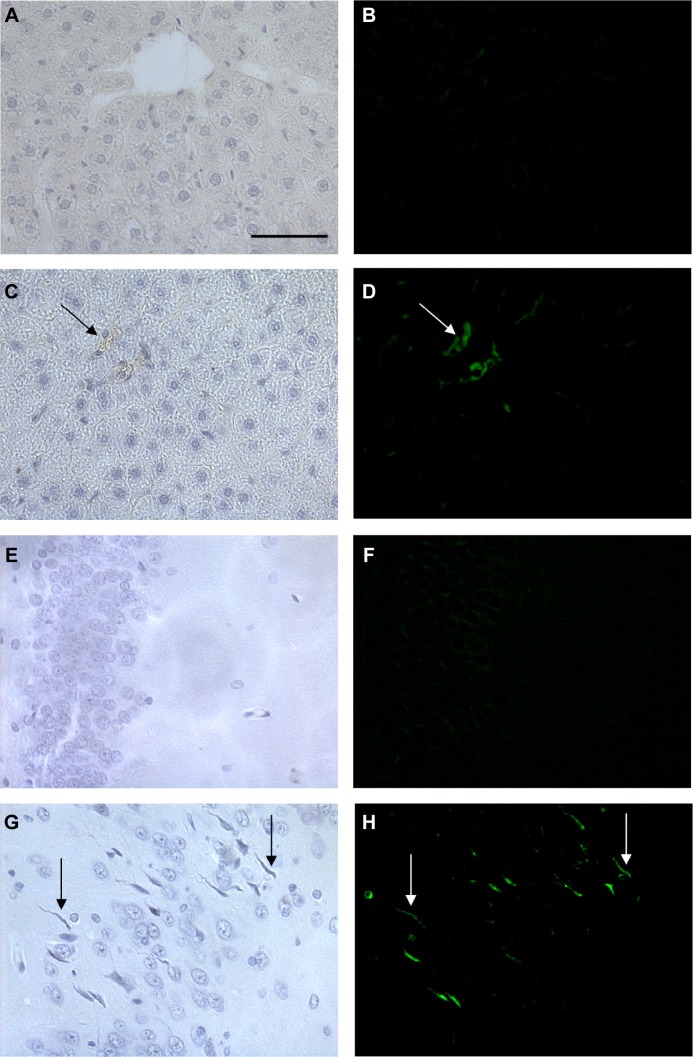
Figure 6.
Representative histological images of the liver and brain in control rats and rats treated with 16 μM gH625.
Notes: The left column shows bright-field images and the right column shows the fluorescein isothiocyanate channel. Each row represents the same field. The scale bar corresponds to 50 μm. (A, B) Liver section of negative control, (C, D) liver of treated animal showing Kupffer cell (arrows) overfilled with gH625, (E, F) a brain section from a negative control, and (G, H) brain of treated animals showing the presence of gH625 in nerve cell processes (arrows).

