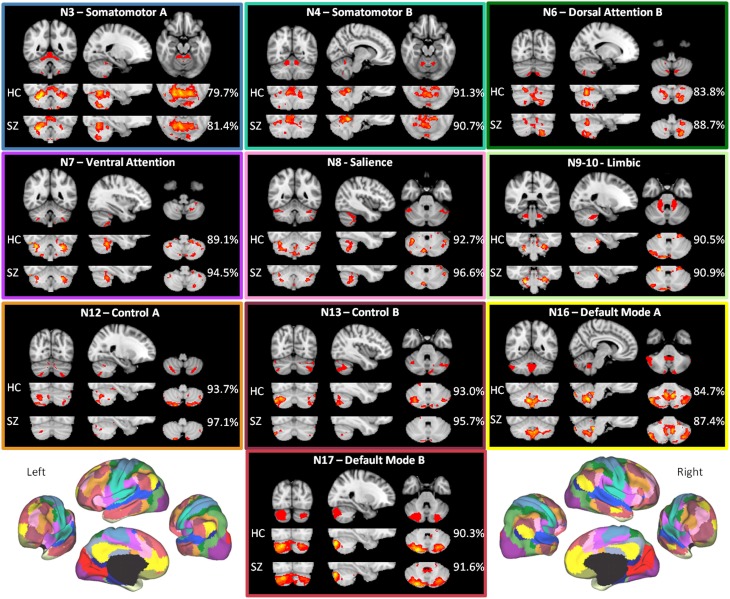
Figure 2.
The within-group maps capture the canonical cerebellar maps with high accuracy. The canonical cerebellar maps (depicted in the uppermost rows) are from Buckner et al. (2011), in which data from 1000 healthy individuals were used to map every voxel within the cerebellum to its most strongly associated cerebral cortical network (Yeo et al., 2011) using a winner-take-all approach. The percentage to the right of each healthy control (HC) or schizophrenia (SZ) group map is the estimation of the map's spatial accuracy (= true positive voxels + true negative voxels)/(positive voxels + negative voxels), using the canonical (Buckner et al., 2011) map as the reference. For the purposes of display, the HC and SZ group maps were thresholded at a significance level of p<0.05, uncorrected. The boxes around each of the networks are highlighted to match the color coding of the networks in Figure 1. The figures of the left and right 17-network parcellation of the human cerebral cortex in the lower left and lower right, respectively, are adapted with permission from Yeo et al. (2011), p. 1139, Figure 13.

