
Table 2.
Differences between schizophrenia and healthy controls in cerebro-cerebellar network connectivity.
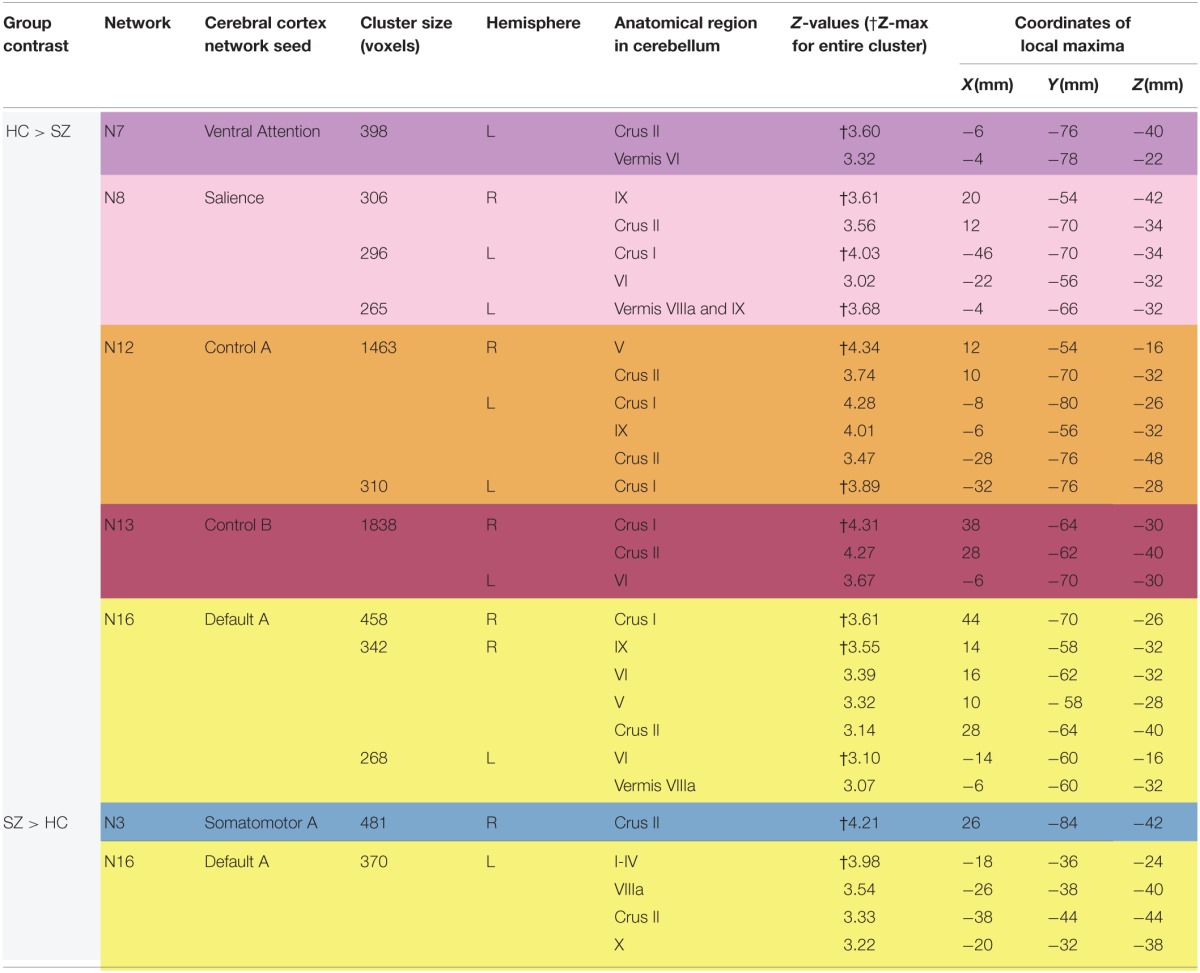
Voxel threshold p < 0.01, cluster corrected at p < 0.05.
The results are color coded to match the network colors as shown in Figure 1.
Official websites use .gov
A
.gov website belongs to an official
government organization in the United States.
Secure .gov websites use HTTPS
A lock (
) or https:// means you've safely
connected to the .gov website. Share sensitive
information only on official, secure websites.
Differences between schizophrenia and healthy controls in cerebro-cerebellar network connectivity.
Voxel threshold p < 0.01, cluster corrected at p < 0.05.
The results are color coded to match the network colors as shown in Figure 1.