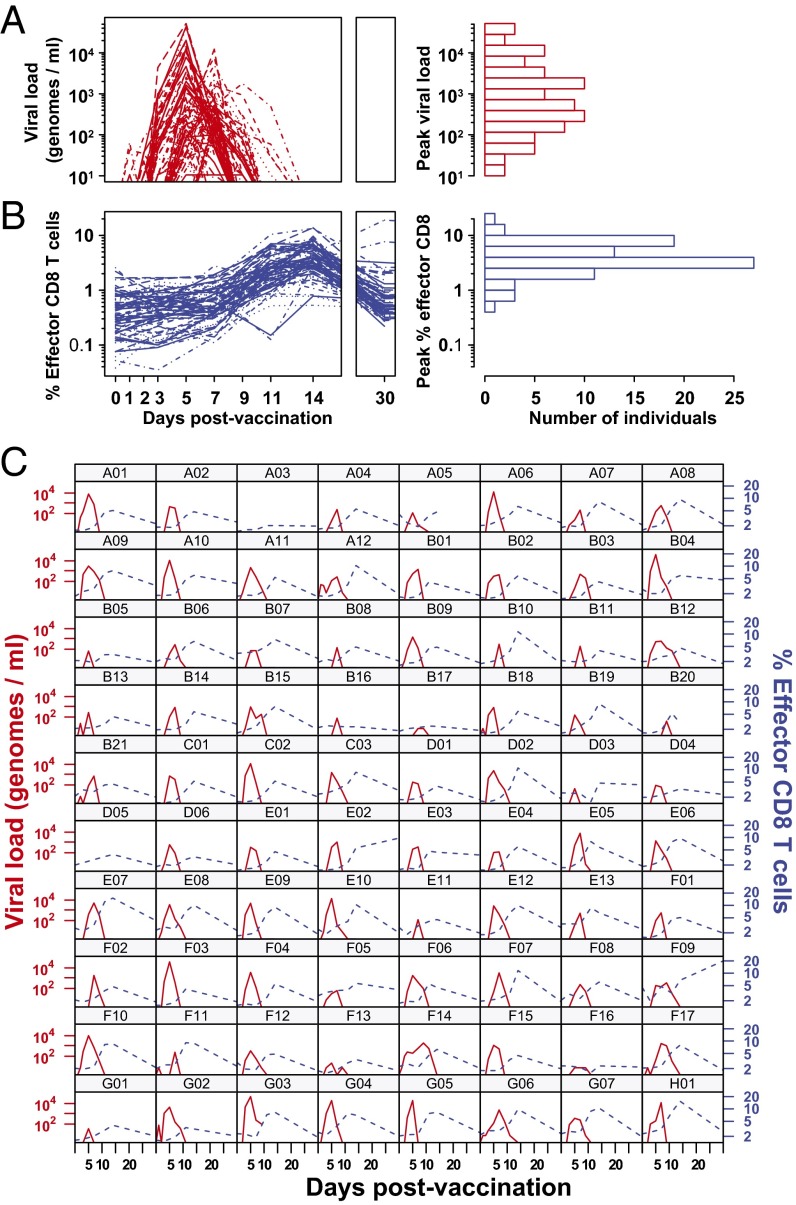
Fig. 1.
Dynamics of viral load and CD8 T-cell response after vaccination with YFV-17D. (A) YFV-17D viral genomes measured by qRT-PCR and (B) YFV-specific effector CD8 T cells as measured by Ki-67+Bcl-2lo for each of 80 vaccinees. Blood samples were drawn on days 0, 1, 2, 3, 5, 7, 9, 11, 14, and 30. (Right) The distribution of peak magnitudes of virus and responding CD8 cells among the vaccinees. We see that there is approximately a four-log spread in the peak viral load and a two-log spread in the peak CD8+ T-cell response between different individuals. (C) Individual kinetics of the viral load (red lines, left axis) and CD8 effector cells (blue lines, right axis) for each vaccinee. In all cases, the CD8 response peaks after virus.

