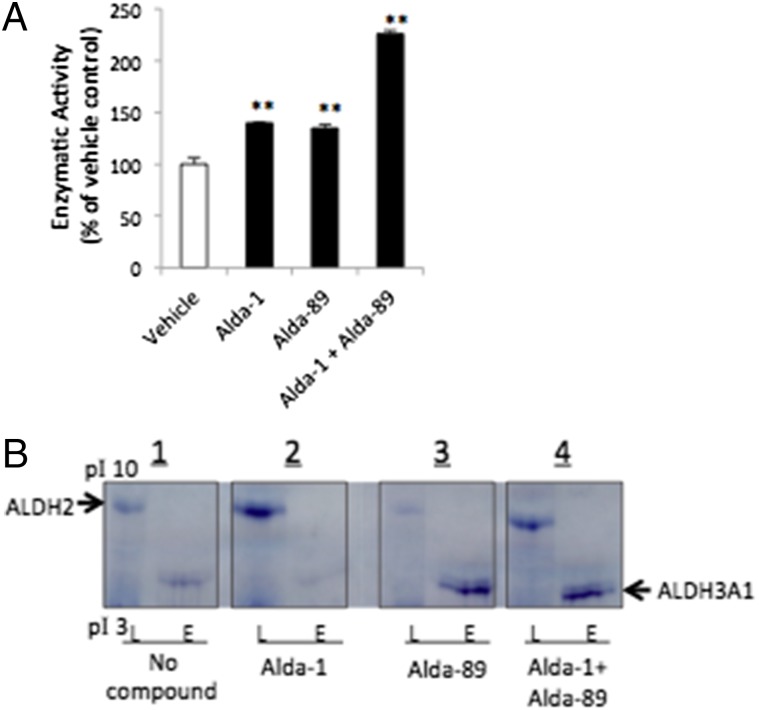
Fig. 2.
(A) The effect of a single activator or combination of Alda-1 and Alda-89 on acetaldehyde metabolism, using a mixture of ALDH2 and ALDH3A1 recombinant enzymes (15 μg each); 10 μM of Alda-1 or Alda-89 were used individually or in combination. Data for each enzyme are from three independent assays (n = 3; **P < 0.01; bars represent the mean ± SD). (B) Isoelectric focusing in-gel activity assay for ALDH2 and ALDH3A1, using tissue homogenates of mouse liver mitochondria fraction (L, 50 μg total protein/lane; rich in ALDH2) or eye (E, 100 μg total protein/lane; rich in ALDH3A1). ALDH2 and ALDH3A1, as indicated by the arrow signs, were separated by their different pI values by precast gels, using the PhastSystem isoeletric focusing (IEF) electrophoresis apparatus. ALDH activities were detected in each gel panel as blue formazan precipitation bands from reduced tetrazolium salt, which is a direct reflection of the ALDH enzyme activity. Shown is staining with (1) no ALDH activators in the staining solution (2), with Alda-1 (3), with Alda-89, or (4) with a mixture of both Alda-1 and Alda-89, 50 μM each.

