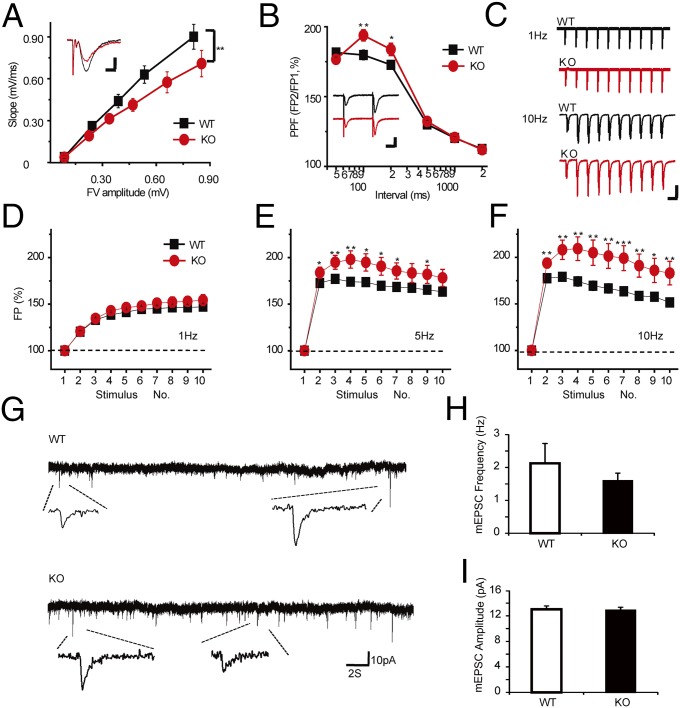
Fig. 4.
Synaptic facilitation defects in Pnkd knockout mice. Hippocampus Schaffer collateral CA1 excitary synapses and motor cortical mEPSCs are studied. (A) The fEPSP slopes are plotted to the afferent fiber volley amplitude. Linear fit slopes for wild-type (k = 1.26 ± 0.10, r = 0.98, 6 mice, 19 slices) and Pnkd−/− mice (k = 0.84 ± 0.08, r = 0.97, 5 mice, 11 slices) are significantly different (P < 0.01, Student t test). (Scale bar, 0.5 mv, 10 ms.) (B) Paired-pulsed facilitation (fEPSP2/fEPSP1) are plotted to the ISI for wild-type (6 mice, 16 slices) and Pnkd−/− mice (5 mice, 10 slices). Two traces represent wild-type and Pnkd−/− at 0.2-s ISI. (Scale bar, 0.5 mv, 25 ms.) (C–F) Synaptic plasticity measured during 1-, 5-, and 10-Hz stimulus trains. Traces are field potential (FP) of wild-type and Pnkd−/− mice under 1- and 10-Hz trains, representatively. (Scale bar, 0.4 mv, 100 ms/1 s.) (C). FP values are normalized to the first synaptic response of the train and plotted as a function of stimulation numbers in the train. Significant differences were noted at 5 Hz (E) and 10 Hz (F) in wild-type (6 mice, 19 slices) vs. Pnkd−/− (5 mice, 11 slices) mice. See also Fig. S3. (G–I) The mEPSC were recorded in pyramidal neurons in layer 2–3 of motor cortical brain slices freshly prepared from 3-wk-old PNKD KO and wild-type mice (KO, n = 15 neurons; wild-type, n = 14 neurons, three to five mice for each group). Two mEPSC traces from wild-type and Pnkd−/− prepartions are shown (G). No significant difference in frequency (H) and amplitude (I) of mEPSC was found between PNKD KO and WT neurons.

