Fig. 2.
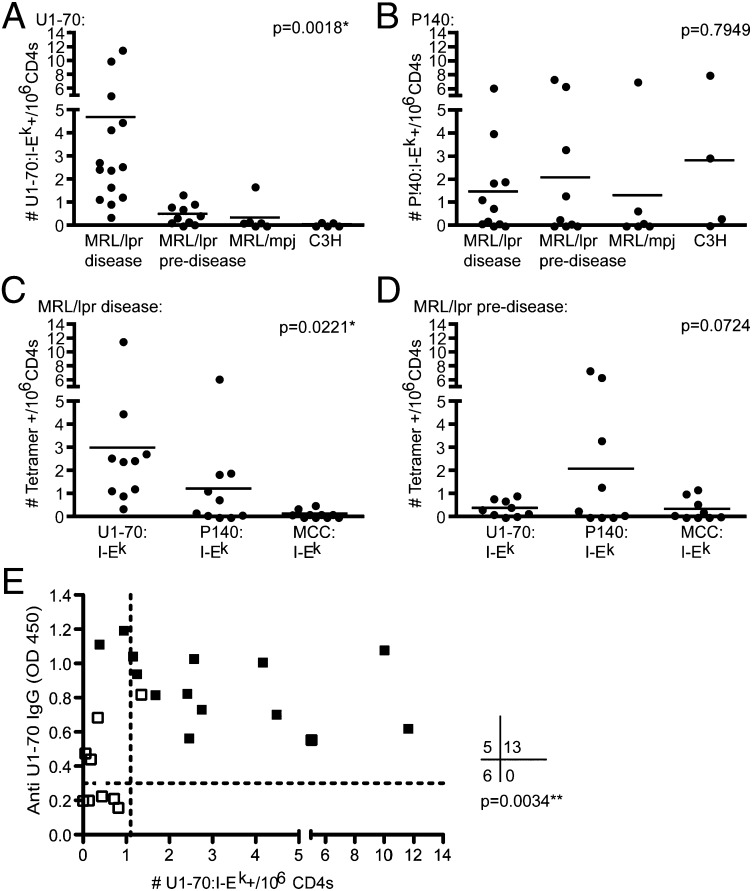
The frequency of U1-70:I-Ek–specific T cells is associated with disease and autoantibody production. (A and B) The frequencies of U1-70:I-Ek–specific (A) and P140:I-Ek–specific (B) CD4+ T cells were determined based on the number of tetramer-positive cells detected following enrichment, and were compared across experiments in MRL/lpr mice with disease (age >15 wk; n = 15), MRL/lpr mice predisease (age <14 wk; n = 10), MRL/mpj mice (age 13–31 wk; n = 6), and C3H mice (age 6–27 wk; n = 5). One-way ANOVA was performed, and Tukey’s posttest revealed significant differences (P < 0.05) in the following groups in A: MRL/lpr mice with disease and MRL/lpr mice predisease, MRL/lpr mice with disease and MRL/mpj, and MRL/lpr mice with disease and C3H. All other comparisons were not statistically different. (C and D) The frequencies of three peptide specificities, stained within the same samples, were compared across experiments in the MRL/lpr mice aged >15 wk (C; n = 10) and MRL/lpr mice aged <14 wk (D; n = 9). One-way ANOVA was performed to determine significant differences between group means; P values are shown, and Tukey’s posttest revealed that U1-70 and MCC specificities were significantly different in C. All other comparisons were not statistically different. (E) The levels of IgG autoantibodies against the whole protein U1-70 in sera from MRL/lpr mice were measured by ELISA and graphed alongside the frequency of U1-70:I-Ek–specific T cells. Solid black dots indicate MRL/lpr mice with disease, and open black dots indicate MRL/lpr mice predisease. Fisher’s exact analysis was performed (n = 24 mice). Dotted lines indicate the cutoffs used for determining categorical groupings, which were determined by calculating 4 SD above the mean levels of anti–U1-70 autoantibodies and mean frequencies of U1-70:I-Ek–specific T cells in control C3H mice.

