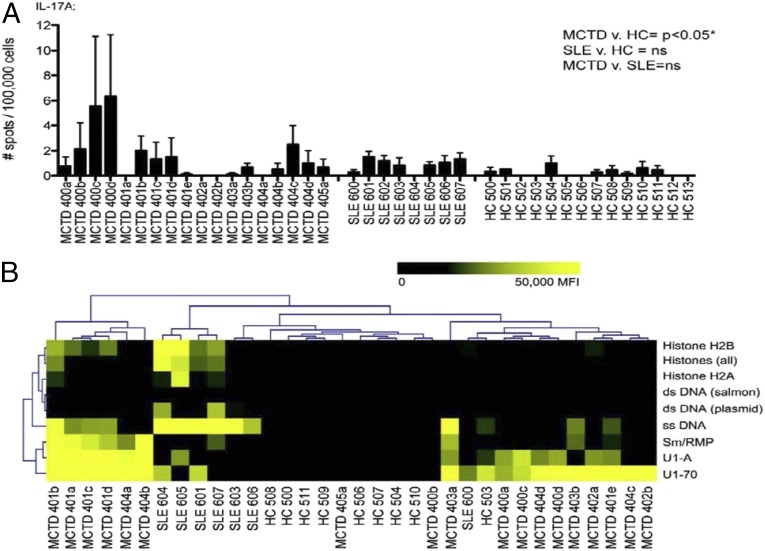
Fig. 4.
U1-70–specific T cells from SLE and MCTD patients produce IL-17. (A) PMBCs and serum were collected from cohorts of patients with MCTD (n = 6; a–e designate temporally ordered, sequential clinic visits for the same patient over time), patients with SLE (n = 8), and healthy controls (n = 14). Bar graphs depict IL-17A production from PBMCs in response to the U1-70 peptide, as detected by ELISPOT. Error bars reflect triplicate wells. One-way ANOVA with Tukey’s posttest was performed to determine statistically significant differences. *P = 0.0309. (B) Heat map of antigens identified as being significantly different in MTCD patients, SLE patients, and healthy controls by SAM. Data are derived from autoantigen microarrays probed with individual patient serum samples. The heat map represents a gradient from low (pseudocolored black) to high (pseudocolored yellow) IgG levels. Data for each MCTD patient visit are shown in A and B to demonstrate variation over time. For statistical analysis of ELISPOT and autoantigen microarray experiments, the average of all visits for each MCTD patient was used.

