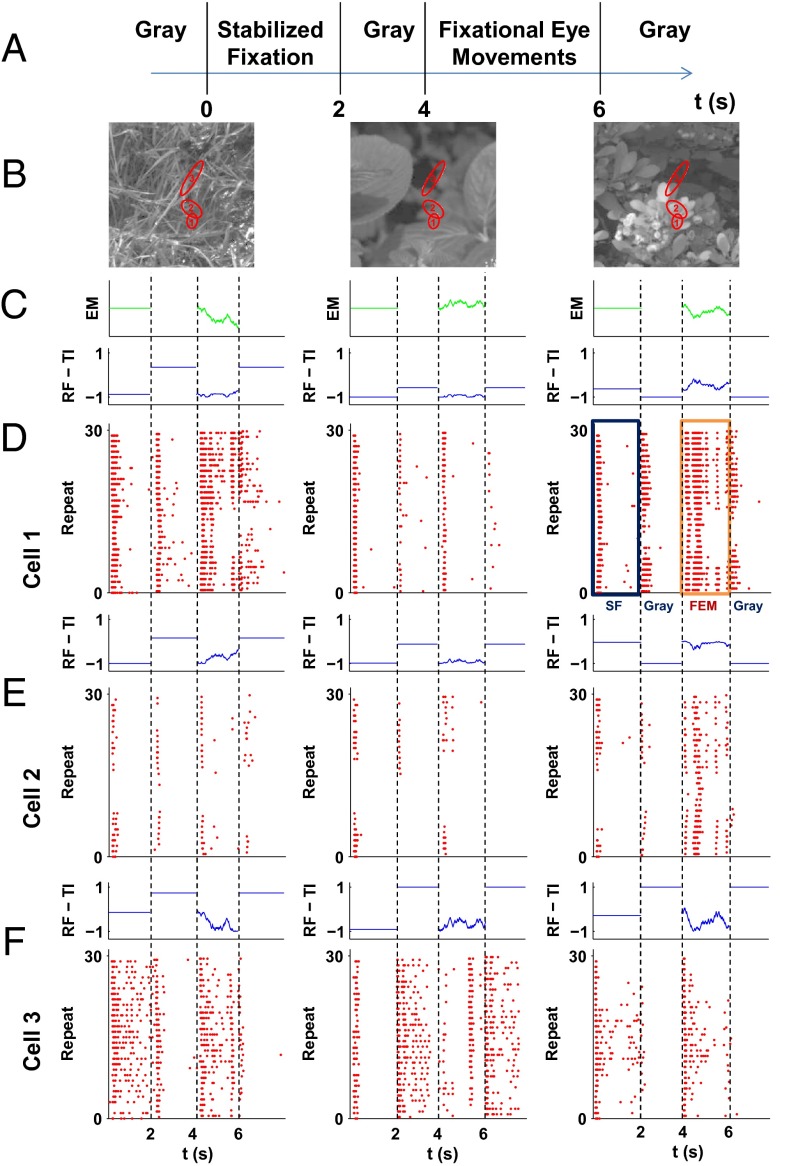
Fig. 1.
Several examples of retinal ganglion cell responses to fixational eye movements superimposed on natural images. (A) An example of the stimulus. At time (t) = 0 s, the image is flashed on the screen and remains static for 2 s. At t = 2 s, the image is replaced with a uniform gray screen for a random interval period of 1.5–2 s, then the fixational eye movements start for 2 s. At an average of t = 6 s, the image is replaced with a uniform gray screen again, with a random interval period of 1.5–2 s. (B) Examples of natural scenes that were used in the experiments. Red ellipses represent the 1-σ radius of receptive fields of selected cells. (C) The trace of fixational instability used for each image. (D–F) Top panels show the change in total illumination in each of the cells’ receptive fields due to the movement. Bottom panels are raster plots of the activity of the cells shown in B in response to the stimulus sequence. All cells responded to the onset of a new image. This onset response extinguished shortly after the image onset. The fixational eye movements evoked a different pattern of responses: They were not synchronized across cells and lasted for the entire segment.

