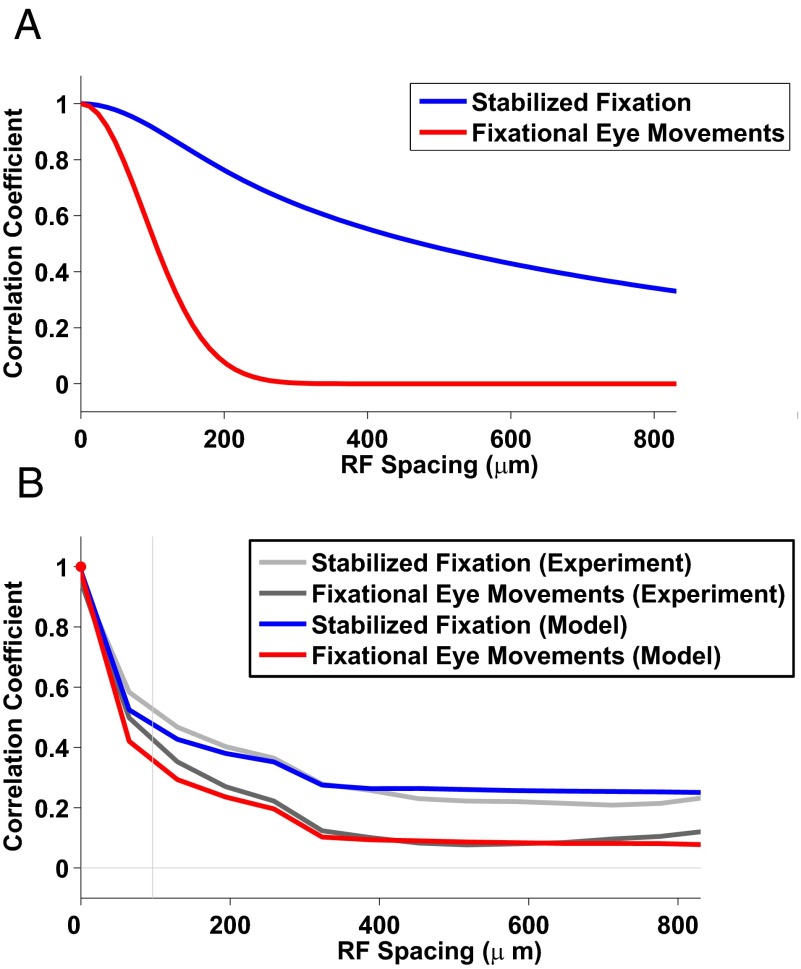
Fig. 4.
Theoretical analysis shows that retinal nonlinearity sets the correlation structure. (A) We calculated the dependence of the correlations on distance in the retinal output as a function of fixational instability vs. the stabilized fixation. Both curves were obtained by numerical integration (Supporting Information, sections 1–6). Fixational instability resulted in a steeper curve, which reduced the correlations to values within two characteristic receptive field sizes, whereas the correlations in the stabilized fixation conditions extended to much larger distances. (B) We simulated the activity of identical cells uniformly distributed across the visual field with a slightly random shift under the assumption of a linear–nonlinear response function. The linear–nonlinear model fit the data well. This is an indication that nonlinearity may determine the correlation level in the retinal output.

