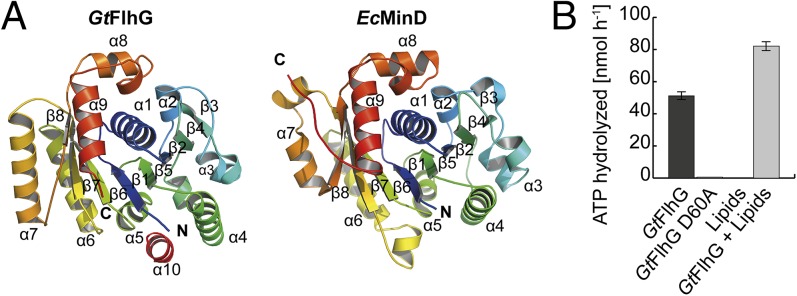
Fig. 1.

Crystal structure of the MinD ATPase FlhG. (A) Cartoon representation of the crystal structures of GtFlhG (this study, Left) and EcMinD (PDB ID: 3Q9L, Right). Both structures are rainbow-colored from the N to the C terminus as indicated by “N” and “C,” respectively. (B) ATPase activity of GtFlhG and the GtFlhG D60A variant (in nanomoles per hour) in the absence or presence of lipids. GtFlhG (20 µM) was incubated with 2 mM ATP at 37 °C for 1 h.
