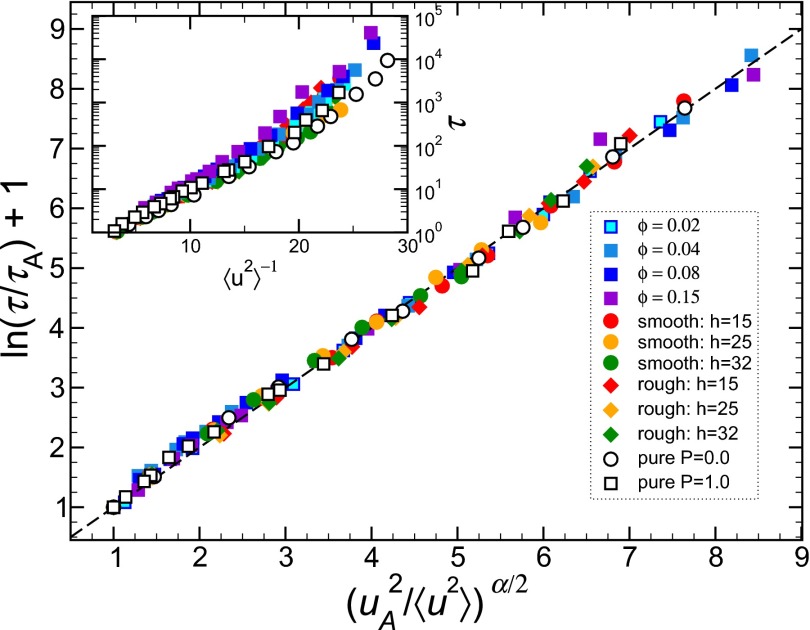
Fig. 2.
Collapsed data of the relative vs. . The data include the pure polymer melts at constant pressure and , thin films with rough and smooth surfaces, and attractive NP nanocomposite systems. The symbols represent the simulated data points and the dashed line represent their linear relationship. (Inset) Variation of τ vs. .

