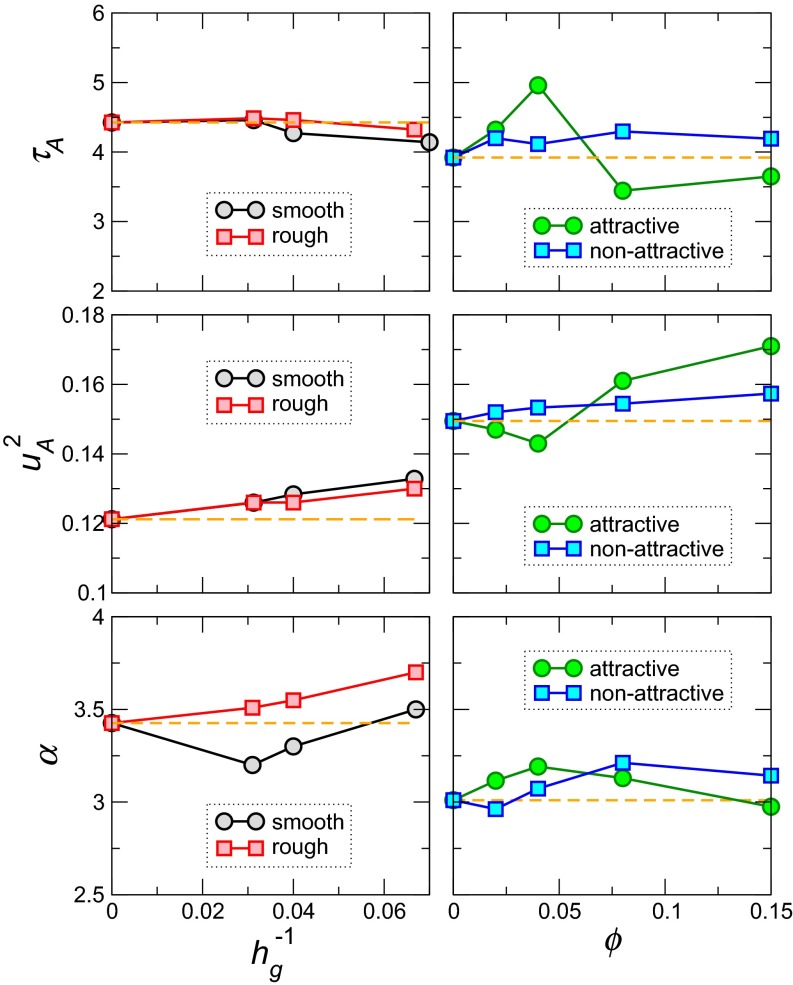
Fig. 3.
Characteristic time and localization scale extracted from simulations data for the film (Left) and composite systems (Right) at the onset temperature . For films, parameters are shown as a function of inverse thickness at , and for composites as a function of nanoparticle concentration ϕ. (Bottom) Values of α from the best fit to Eq. 4. Note that the variations of , , and α are all small.

