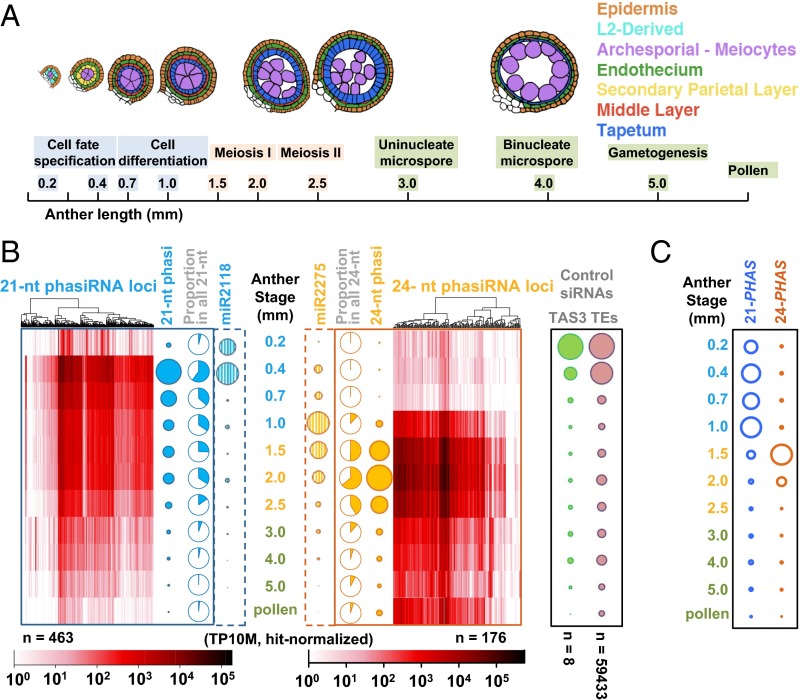
Fig. 2.
The 21-nt premeiotic and 24-nt meiotic phasiRNAs are developmentally regulated. (A) Anthers at 10 different lengths (developmental stages) were analyzed plus pollen. Above, a schematic of cell patterns in a single lobe of the anther; cell types in colors shown in key (Right). (B) Heat maps depicting the abundances of 21-nt premeiotic phasiRNAs from 463 loci (Left) and 24-nt meiotic phasiRNAs from 176 loci (Right) at each stage. Hierarchical clustering was based on similarity of expression pattern. (Left) Solid bubbles represent the total abundance of phasiRNAs; blue pie charts represent the proportion of 21-nt phasiRNAs from all 21-nt sRNAs at each stage; striped blue bubbles represent miR2118 abundances (trigger of premeiotic phasiRNA). (Right) The solid and striped orange bubbles represent 24-nt phasiRNA and miR2275 abundances, respectively; orange pie charts represent 24-nt phasiRNAs from all 24-nt sRNAs. Controls (Far Right): green represents TAS3-derived ta-siRNAs, and pink represents all TE-associated siRNAs mapped to the first 100 Mb of maize chromosome 1 (as a proxy for the whole genome). (C) Quantification of 21-PHAS and 24-PHAS precursor transcripts by RNA-seq.

