Figure 5.
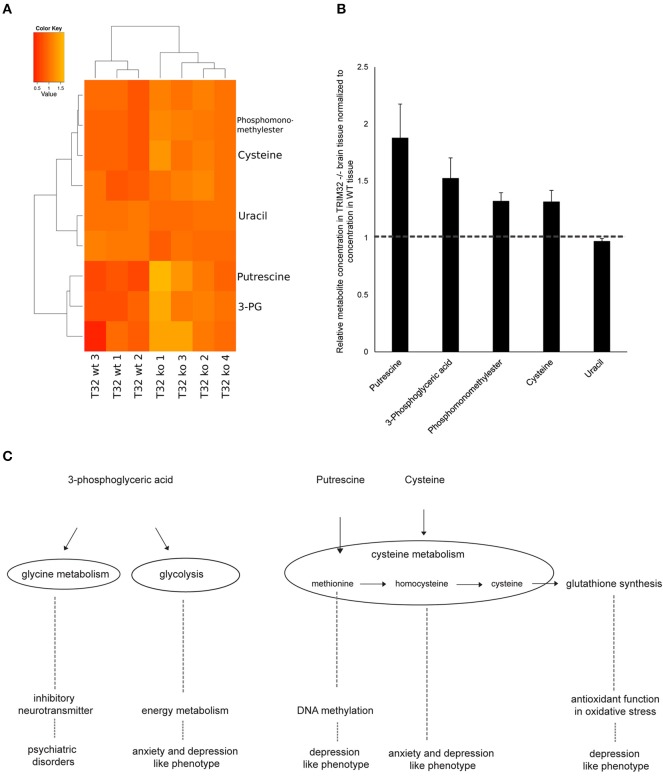
(A) Heatmap showing metabolites that differ significantly between wt and TRIM32 ko mice (Student's t-test, p-value < 0.05). Medians of three technical replicates were used as basis for this data analysis. For visualization the individual intensities for each compound were divided by its mean intensity across all replicates. Colors represent metabolite levels in TRIM32 ko and wt brain tissue. Clustering was performed on Euclidean distances using Ward's minimum variance method. Three wt and 4 ko animals were used for analysis. (B) Relative concentration of metabolites that differ significantly in concentration between wt and TRIM32 ko mice. Data were calculated as means with standard error of the mean and values of TRIM32 ko mice were normalized to wt values. (C) Schematic overview depicting metabolomic pathways to which metabolites that were significantly different in concentration are linked to and their involvement in brain disorders and behavioral phenotypes.

