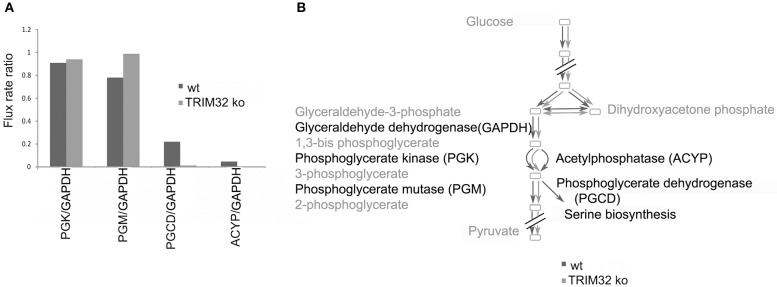
Figure 6.

Flux distribution estimated by random sampling for the wild type and the mutant models built via the FASTCORMICS workflow. (A) Random sampling results. Ratio of the flux rates for phosphoglycerate kinase (PGK), phosphoglycerate mutase (PGM), and acetylphosphatase (ACYP) over glyceraldehyde dehydrogenase (GADP) represented in blue for the wild type and in red for the mutant. (B) Schematic representation of the qualitative wild type (dark gray) and mutant (light gray) fluxes over the glycolysis pathway.
